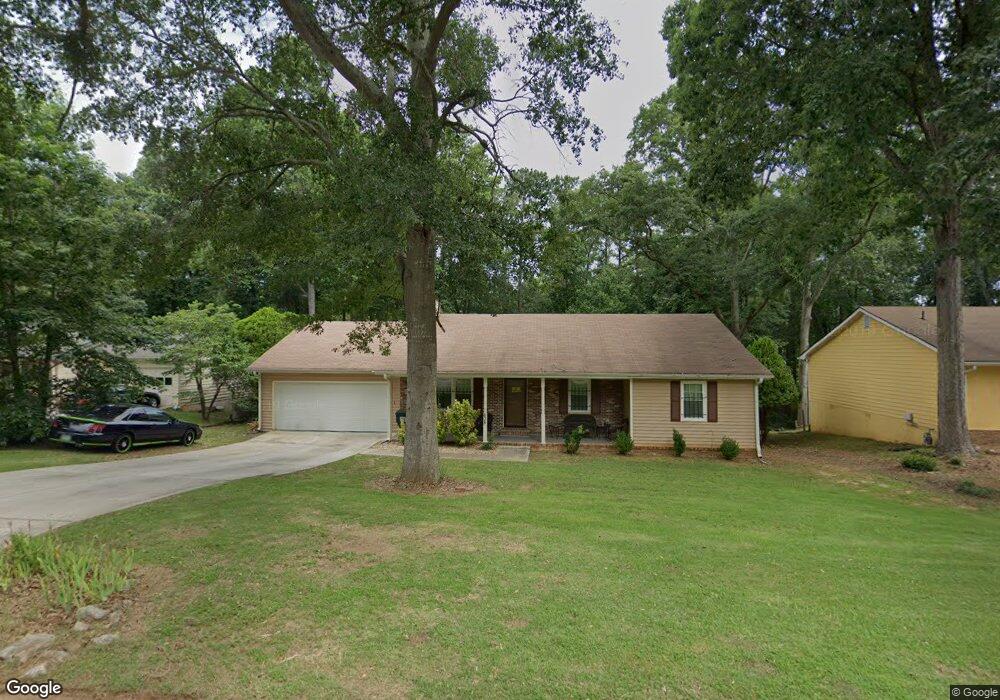
638 Almand Branch Rd SE Conyers, GA 30094
Estimated Value: $243,192 - $276,000
3
Beds
2
Baths
1,707
Sq Ft
$151/Sq Ft
Est. Value
About This Home
This home is located at 638 Almand Branch Rd SE, Conyers, GA 30094 and is currently estimated at $258,548, approximately $151 per square foot. 638 Almand Branch Rd SE is a home located in Rockdale County with nearby schools including Sims Elementary School, Edwards Middle School, and Heritage High School.
Ownership History
Date
Name
Owned For
Owner Type
Purchase Details
Closed on
May 29, 2018
Sold by
Shantanda Wood
Bought by
Shantanda Freeman
Current Estimated Value
Purchase Details
Closed on
Jun 29, 2015
Sold by
Wood Shantanda
Bought by
Wood Shantanda
Purchase Details
Closed on
Jun 29, 2010
Sold by
Jewel Of The South Inc
Bought by
Wood Shantanda
Home Financials for this Owner
Home Financials are based on the most recent Mortgage that was taken out on this home.
Original Mortgage
$76,176
Interest Rate
5.5%
Mortgage Type
FHA
Purchase Details
Closed on
Mar 2, 2010
Sold by
Federal Natl Mtg Assn Fnma
Bought by
Jewel Of The South Inc
Purchase Details
Closed on
Jul 7, 2009
Sold by
Aurora Loan Services Llc
Bought by
Federal National Mortgage Association
Create a Home Valuation Report for This Property
The Home Valuation Report is an in-depth analysis detailing your home's value as well as a comparison with similar homes in the area
Home Values in the Area
Average Home Value in this Area
Purchase History
| Date | Buyer | Sale Price | Title Company |
|---|---|---|---|
| Shantanda Freeman | -- | -- | |
| Wood Shantanda | -- | -- | |
| Wood Shantanda | $89,000 | -- | |
| Jewel Of The South Inc | -- | -- | |
| Federal National Mortgage Association | $133,974 | -- | |
| Aurora Ln Svcs Llc | $133,973 | -- |
Source: Public Records
Mortgage History
| Date | Status | Borrower | Loan Amount |
|---|---|---|---|
| Previous Owner | Wood Shantanda | $76,176 |
Source: Public Records
Tax History Compared to Growth
Tax History
| Year | Tax Paid | Tax Assessment Tax Assessment Total Assessment is a certain percentage of the fair market value that is determined by local assessors to be the total taxable value of land and additions on the property. | Land | Improvement |
|---|---|---|---|---|
| 2024 | $2,354 | $99,280 | $18,480 | $80,800 |
| 2023 | $1,676 | $75,840 | $12,800 | $63,040 |
| 2022 | $1,336 | $62,600 | $12,800 | $49,800 |
| 2021 | $1,108 | $51,280 | $8,960 | $42,320 |
| 2020 | $947 | $46,560 | $8,600 | $37,960 |
| 2019 | $471 | $30,320 | $4,680 | $25,640 |
| 2018 | $474 | $30,320 | $4,680 | $25,640 |
| 2017 | $388 | $27,360 | $4,680 | $22,680 |
| 2016 | $358 | $27,360 | $4,680 | $22,680 |
| 2015 | $458 | $30,760 | $4,680 | $26,080 |
| 2014 | $453 | $32,320 | $3,960 | $28,360 |
| 2013 | -- | $30,520 | $4,840 | $25,680 |
Source: Public Records
Map
Nearby Homes
- 574 Almand Branch Rd SE Unit 1
- 2717 Stanton Woods Dr SE
- 693 Deering Rd SE
- 549 Greenview Ave SE
- 665 Huron Ct SE
- 2910 Stanton Rd SE
- 1511 Hillside Dr SE
- 2617 Laurel Woods Ln SE Unit 3
- 2851 Stanton Rd SE
- 1508 Hillside Dr SE
- 2987 Landmark Dr SE
- 2924 Raintree Dr SE
- 2923 Raintree Dr SE
- 1920 Logan Ln
- 3021 Lakeridge Dr SE
- 726 Shoreline Trail SE
- 1420 Hillside Place SE
- 3027 Lakeridge Dr SE
- 3014 Lakeridge Dr SE
- 820 Bridgewater Way SE
- 648 Almand Branch Rd SE
- 628 Almand Branch Rd SE Unit 1
- 609 Pine Ridge Trail SE Unit 3
- 618 Almand Branch Rd SE Unit 1
- 656 Almand Branch Rd SE
- 619 Pine Ridge Trail SE
- 639 Almand Branch Rd SE
- 599 Pine Ridge Trail SE
- 631 Almand Branch Rd SE
- 647 Almand Branch Rd SE
- 664 Almand Branch Rd SE
- 621 Almand Branch Rd SE
- 610 Almand Branch Rd SE Unit 1
- 657 Almand Branch Rd SE
- 600 Pine Ridge Trail SE
- 613 Almand Branch Rd SE
- 665 Almand Branch Rd SE Unit 2
- 579 Pine Ridge Trail SE
- 672 Almand Branch Rd SE
- 0 Deering Rd SE Unit 3279606