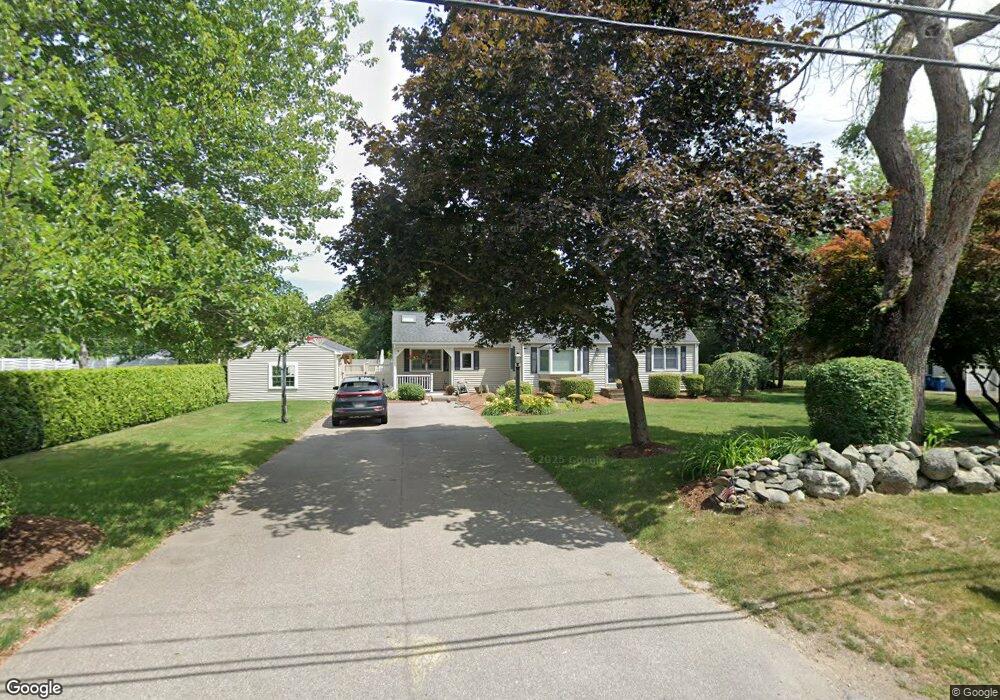
638 Bridge St East Bridgewater, MA 02333
Estimated Value: $526,000 - $722,000
3
Beds
3
Baths
1,814
Sq Ft
$350/Sq Ft
Est. Value
About This Home
This home is located at 638 Bridge St, East Bridgewater, MA 02333 and is currently estimated at $634,517, approximately $349 per square foot. 638 Bridge St is a home located in Plymouth County with nearby schools including Central Elementary School, Gordon W Mitchell Middle School, and East Bridgewater Jr./Sr. High School.
Ownership History
Date
Name
Owned For
Owner Type
Purchase Details
Closed on
Mar 28, 2016
Sold by
Mcmanus Brian
Bought by
Mcmanus Brian and Mcmanus Jill
Current Estimated Value
Purchase Details
Closed on
Nov 21, 2003
Sold by
Mcmanus Sandra J
Bought by
Mcmanus Brian Patrick
Home Financials for this Owner
Home Financials are based on the most recent Mortgage that was taken out on this home.
Original Mortgage
$200,000
Interest Rate
5.98%
Mortgage Type
Purchase Money Mortgage
Create a Home Valuation Report for This Property
The Home Valuation Report is an in-depth analysis detailing your home's value as well as a comparison with similar homes in the area
Home Values in the Area
Average Home Value in this Area
Purchase History
| Date | Buyer | Sale Price | Title Company |
|---|---|---|---|
| Mcmanus Brian | -- | -- | |
| Mcmanus Brian Patrick | $250,000 | -- |
Source: Public Records
Mortgage History
| Date | Status | Borrower | Loan Amount |
|---|---|---|---|
| Previous Owner | Mcmanus Brian Patrick | $200,000 | |
| Previous Owner | Mcmanus Brian Patrick | $50,000 |
Source: Public Records
Tax History Compared to Growth
Tax History
| Year | Tax Paid | Tax Assessment Tax Assessment Total Assessment is a certain percentage of the fair market value that is determined by local assessors to be the total taxable value of land and additions on the property. | Land | Improvement |
|---|---|---|---|---|
| 2025 | $6,969 | $509,800 | $176,300 | $333,500 |
| 2024 | $6,787 | $490,400 | $169,600 | $320,800 |
| 2023 | $6,690 | $463,000 | $169,600 | $293,400 |
| 2022 | $6,249 | $400,600 | $154,200 | $246,400 |
| 2021 | $6,140 | $360,100 | $148,200 | $211,900 |
| 2020 | $5,929 | $342,900 | $142,500 | $200,400 |
| 2019 | $5,630 | $320,600 | $136,200 | $184,400 |
| 2018 | $5,433 | $302,500 | $136,200 | $166,300 |
| 2017 | $5,276 | $288,300 | $129,900 | $158,400 |
| 2016 | $5,128 | $282,400 | $129,900 | $152,500 |
| 2015 | $4,946 | $278,500 | $129,000 | $149,500 |
| 2014 | $4,815 | $277,200 | $126,300 | $150,900 |
Source: Public Records
Map
Nearby Homes
- 587 Bridge St
- 26 Meadowbrook Dr
- 28 Brookbend Way E
- 51 Stonegate Dr
- 182 Crystal Water Dr Unit 182
- 71 Stonegate Dr
- 78 Crystal Water Dr
- 217 Crystal Water Dr
- 121 South St
- 455 Plymouth St
- 1993 Washington St
- 94 Pond St
- 2045 Washington St
- 29 Hayes Rd
- 261 Plymouth St
- 1 Simmons Place
- 23 Stone Meadow Dr
- 12 Bridge St
- 0 Three Rivers Dr
- 114 Plain St