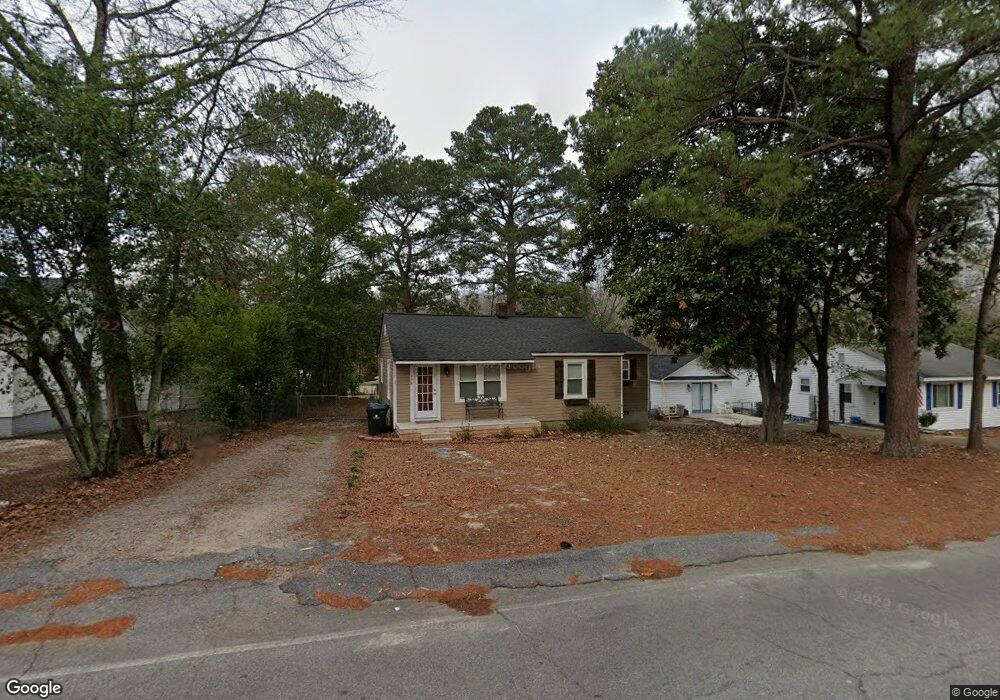
638 Brooks Ave West Columbia, SC 29169
Estimated Value: $137,000 - $166,000
2
Beds
1
Bath
900
Sq Ft
$163/Sq Ft
Est. Value
About This Home
This home is located at 638 Brooks Ave, West Columbia, SC 29169 and is currently estimated at $146,653, approximately $162 per square foot. 638 Brooks Ave is a home located in Lexington County with nearby schools including Cayce Elementary, Cyril B. Busbee Creative Arts Academy, and Brookland-Cayce High School.
Ownership History
Date
Name
Owned For
Owner Type
Purchase Details
Closed on
Dec 7, 2020
Sold by
Mike Bruce and Mike Debbie
Bought by
Jones Grayson W
Current Estimated Value
Home Financials for this Owner
Home Financials are based on the most recent Mortgage that was taken out on this home.
Original Mortgage
$98,025
Outstanding Balance
$87,427
Interest Rate
2.8%
Mortgage Type
New Conventional
Estimated Equity
$59,226
Purchase Details
Closed on
May 6, 2019
Sold by
Shull Andrea C
Bought by
Mike Bruce and Mike Debbie
Purchase Details
Closed on
Nov 22, 2016
Sold by
Shull Andrea C
Bought by
Shull Andrea C
Purchase Details
Closed on
Apr 27, 2015
Sold by
Hollingsworth George
Bought by
Glenn Angela
Home Financials for this Owner
Home Financials are based on the most recent Mortgage that was taken out on this home.
Original Mortgage
$67,415
Interest Rate
3.87%
Mortgage Type
New Conventional
Create a Home Valuation Report for This Property
The Home Valuation Report is an in-depth analysis detailing your home's value as well as a comparison with similar homes in the area
Home Values in the Area
Average Home Value in this Area
Purchase History
| Date | Buyer | Sale Price | Title Company |
|---|---|---|---|
| Jones Grayson W | $99,000 | None Available | |
| Mike Bruce | $77,000 | None Available | |
| Shull Andrea C | -- | None Available | |
| Glenn Angela | -- | -- | |
| Shull Andrea C | $69,500 | -- |
Source: Public Records
Mortgage History
| Date | Status | Borrower | Loan Amount |
|---|---|---|---|
| Open | Jones Grayson W | $98,025 | |
| Previous Owner | Shull Andrea C | $67,415 |
Source: Public Records
Tax History Compared to Growth
Tax History
| Year | Tax Paid | Tax Assessment Tax Assessment Total Assessment is a certain percentage of the fair market value that is determined by local assessors to be the total taxable value of land and additions on the property. | Land | Improvement |
|---|---|---|---|---|
| 2024 | $750 | $3,960 | $576 | $3,384 |
| 2023 | $757 | $3,960 | $576 | $3,384 |
| 2022 | $764 | $3,960 | $576 | $3,384 |
| 2020 | $571 | $4,620 | $864 | $3,756 |
| 2019 | $32 | $2,753 | $576 | $2,177 |
| 2018 | $37 | $2,753 | $576 | $2,177 |
| 2017 | $25 | $2,753 | $576 | $2,177 |
| 2016 | $36 | $2,752 | $576 | $2,176 |
| 2015 | $1,044 | $2,616 | $547 | $2,069 |
| 2014 | $1,044 | $3,414 | $972 | $2,442 |
| 2013 | -- | $3,410 | $970 | $2,440 |
Source: Public Records
Map
Nearby Homes
- 706 Westside Dr
- 725 Brooks Ave
- 2312 Rainbow Dr
- 2405 Rainbow Dr
- 309 Hammond Ave
- 135 Silver Run Place
- 826 Jefferson St
- 116 Silver Run Place
- 339 Gum Swamp Trail
- 2024 Platt Springs Rd
- 349 Gum Swamp Trail
- 212 Alexandria St
- 1210 Decatur St
- 153 Cavendish Dr
- 151 Cavendish Dr
- 157 Cavendish Dr
- TBD Woodfield Jupiter & Daisey Track
- 1802 D Ave
- 615 Dawn Dr
- Oak Plan at Faith Hills