K
Landlord's Agent in 2020
Kristie Aussubel
Presidential Properties


Estimated Value: $683,185 - $782,000
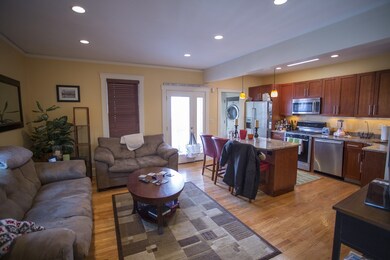
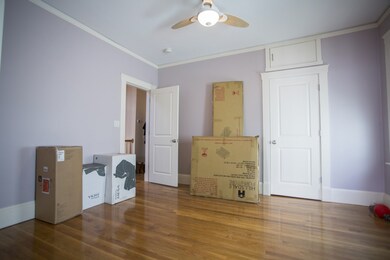
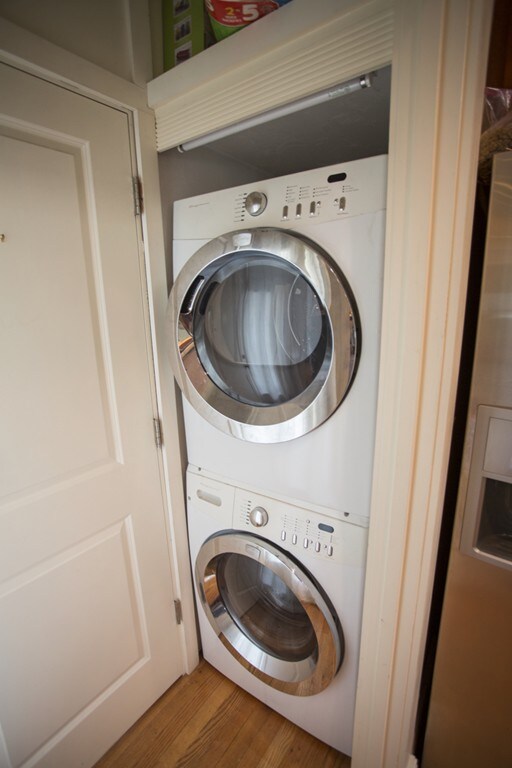
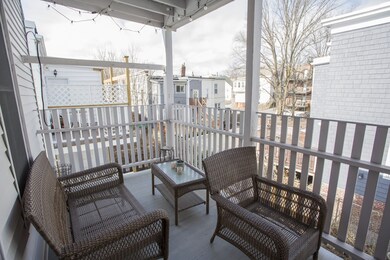
Newly renovated South Boston 2 bedroom 2 bathroom condominium available for rent. Second floor location featuring an open and spacious layout, granite kitchen with a large breakfast bar, stainless steel appliances, lots of kitchen cabinet space, central AC, recessed lighting, and hardwood flooring. There is a washer and dryer in the unit. Private back porch along with a shared common yard. A dog or cat may be allowed, the landlord decides on a case by case basis after review of the application. Steps to Bus 11 and walking distance to M Street Beach, Castle Island, Red T Line, and Commuter Rail and conveniently located close to South Bay Shopping Center. Available April 1 for $3200 a month. Email to schedule a tour!
Last Agent to Rent the Property
Kristie Aussubel
Presidential Properties Listed on: 03/03/2020
Last Renter's Agent
Jessica Mulder
Amo Realty - Boston City Properties
| Date | Buyer | Sale Price | Title Company |
|---|---|---|---|
| Dion Adrienne | $473,000 | -- | |
| Dion Adrienne | $473,000 | -- |
| Date | Status | Borrower | Loan Amount |
|---|---|---|---|
| Open | Dion Adrienne | $402,050 | |
| Closed | Dion Adrienne | $402,050 |
| Date | Event | Price | List to Sale | Price per Sq Ft |
|---|---|---|---|---|
| 04/15/2020 04/15/20 | Rented | $3,200 | 0.0% | -- |
| 03/10/2020 03/10/20 | Under Contract | -- | -- | -- |
| 03/03/2020 03/03/20 | For Rent | $3,200 | +6.7% | -- |
| 04/01/2019 04/01/19 | Rented | $3,000 | -6.3% | -- |
| 02/28/2019 02/28/19 | Under Contract | -- | -- | -- |
| 02/11/2019 02/11/19 | For Rent | $3,200 | -- | -- |
| Year | Tax Paid | Tax Assessment Tax Assessment Total Assessment is a certain percentage of the fair market value that is determined by local assessors to be the total taxable value of land and additions on the property. | Land | Improvement |
|---|---|---|---|---|
| 2025 | $7,034 | $607,400 | $0 | $607,400 |
| 2024 | $6,378 | $585,100 | $0 | $585,100 |
| 2023 | $6,156 | $573,200 | $0 | $573,200 |
| 2022 | $5,995 | $551,000 | $0 | $551,000 |
| 2021 | $5,764 | $540,200 | $0 | $540,200 |
| 2020 | $5,273 | $499,300 | $0 | $499,300 |
| 2019 | $4,920 | $466,800 | $0 | $466,800 |
| 2018 | $4,657 | $444,400 | $0 | $444,400 |
| 2017 | $4,399 | $415,400 | $0 | $415,400 |
| 2016 | $4,311 | $391,900 | $0 | $391,900 |
| 2015 | $4,217 | $348,200 | $0 | $348,200 |
| 2014 | $3,910 | $310,800 | $0 | $310,800 |
K
Landlord's Agent in 2020
Kristie Aussubel
Presidential Properties
J
Tenant's Agent in 2020
Jessica Mulder
Amo Realty - Boston City Properties
P
Buyer's Agent in 2019
Paul Ireland
Naples Realty Group
(617) 536-8500
1 Total Sale
Source: MLS Property Information Network (MLS PIN)
MLS Number: 72627479
APN: SBOS-000000-000007-002327-000014
Disclaimer: Certain information contained herein is derived from information provided by parties other than Homes.com. All information provided is deemed reliable, but is not guaranteed to be accurate and should be independently verified.
![]() The property listing data and information, or the Images, set forth herein were provided to MLS Property Information Network, Inc. from third party sources, including sellers, lessors and public records, and were compiled by MLS Property Information Network, Inc. The property listing data and information, and the Images, are for the personal, non-commercial use of consumers having a good faith interest in purchasing or leasing listed properties of the type displayed to them and may not be used for any purpose other than to identify prospective properties which such consumers may have a good faith interest in purchasing or leasing. MLS Property Information Network, Inc. and its subscribers disclaim any and all representations and warranties as to the accuracy of the property listing data and information, or as to the accuracy of any of the Images, set forth herein.
The property listing data and information, or the Images, set forth herein were provided to MLS Property Information Network, Inc. from third party sources, including sellers, lessors and public records, and were compiled by MLS Property Information Network, Inc. The property listing data and information, and the Images, are for the personal, non-commercial use of consumers having a good faith interest in purchasing or leasing listed properties of the type displayed to them and may not be used for any purpose other than to identify prospective properties which such consumers may have a good faith interest in purchasing or leasing. MLS Property Information Network, Inc. and its subscribers disclaim any and all representations and warranties as to the accuracy of the property listing data and information, or as to the accuracy of any of the Images, set forth herein.
