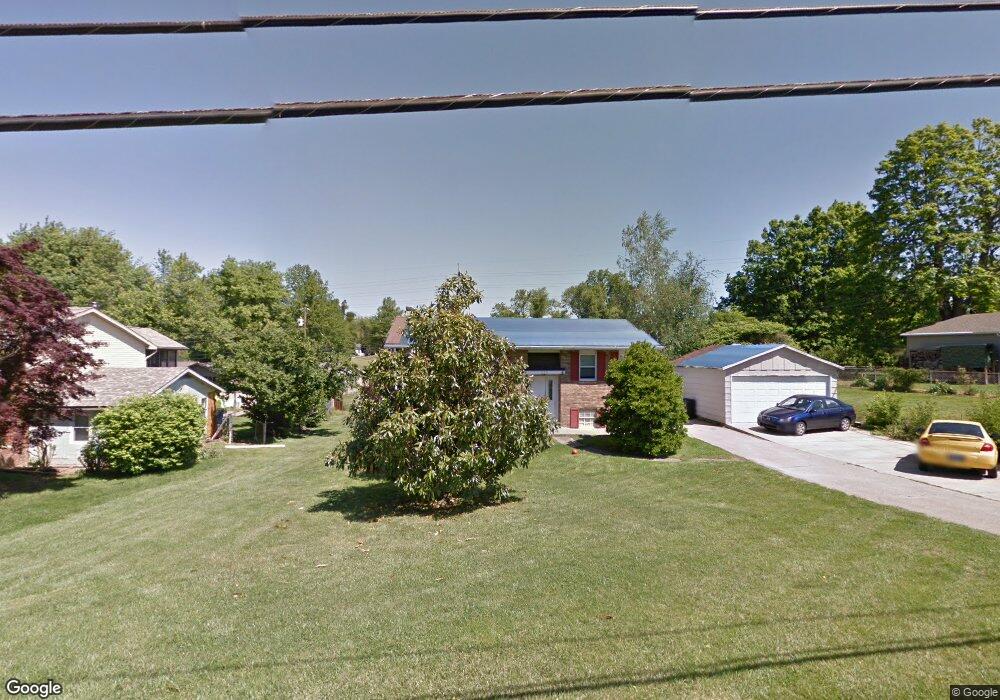
638 E Main St Newburgh, IN 47630
Estimated Value: $224,000 - $295,000
3
Beds
2
Baths
1,016
Sq Ft
$250/Sq Ft
Est. Value
About This Home
This home is located at 638 E Main St, Newburgh, IN 47630 and is currently estimated at $254,496, approximately $250 per square foot. 638 E Main St is a home located in Warrick County with nearby schools including Newburgh Elementary School, Castle North Middle School, and Castle High School.
Ownership History
Date
Name
Owned For
Owner Type
Purchase Details
Closed on
Dec 21, 2004
Sold by
Coffman Janis L
Bought by
Mcmanus Hester J
Current Estimated Value
Home Financials for this Owner
Home Financials are based on the most recent Mortgage that was taken out on this home.
Original Mortgage
$111,254
Outstanding Balance
$55,939
Interest Rate
5.79%
Mortgage Type
FHA
Estimated Equity
$198,557
Create a Home Valuation Report for This Property
The Home Valuation Report is an in-depth analysis detailing your home's value as well as a comparison with similar homes in the area
Home Values in the Area
Average Home Value in this Area
Purchase History
| Date | Buyer | Sale Price | Title Company |
|---|---|---|---|
| Mcmanus Hester J | -- | None Available |
Source: Public Records
Mortgage History
| Date | Status | Borrower | Loan Amount |
|---|---|---|---|
| Open | Mcmanus Hester J | $111,254 |
Source: Public Records
Tax History
| Year | Tax Paid | Tax Assessment Tax Assessment Total Assessment is a certain percentage of the fair market value that is determined by local assessors to be the total taxable value of land and additions on the property. | Land | Improvement |
|---|---|---|---|---|
| 2025 | $1,752 | $199,700 | $52,900 | $146,800 |
| 2024 | $1,600 | $190,800 | $52,900 | $137,900 |
| 2023 | $1,600 | $187,000 | $52,900 | $134,100 |
| 2022 | $1,513 | $166,300 | $24,900 | $141,400 |
| 2021 | $1,250 | $133,000 | $20,000 | $113,000 |
| 2020 | $1,105 | $127,400 | $20,000 | $107,400 |
| 2019 | $815 | $106,700 | $20,000 | $86,700 |
| 2018 | $786 | $104,800 | $20,000 | $84,800 |
| 2017 | $781 | $103,700 | $20,000 | $83,700 |
| 2016 | $761 | $102,800 | $20,000 | $82,800 |
| 2014 | $769 | $108,100 | $22,600 | $85,500 |
| 2013 | $757 | $108,900 | $22,600 | $86,300 |
Source: Public Records
Map
Nearby Homes
- 630 E Main St
- 322 Shady Ln
- 318 E Main St
- 305 E Jennings St
- 210 E Main St
- 706 Rose Dr
- 209 Sycamore St
- 709 Cypress St
- 110 E Gray St
- 101 E Jennings St Unit E
- 8 E Gray St
- 6211 Pfafflin Lake Blvd
- 217 Monroe St
- 5610 Saint Catherine Ct
- 110 Monroe St
- 1 Hillside Trail
- 7366 Parkridge Rd
- 626 Monroe St
- 7711 Woodland Dr
- 6055 Pfafflin Lake Blvd
- 634 E Main St
- 633 Outer Gray St
- 725 Outer Gray St
- 727 E Main St
- 631 Outer Gray St
- 806 E Main St
- 629 Outer Gray St
- 726 Outer Gray St
- 626 E Main St
- 800 Outer Gray St
- 627 Outer Gray St
- 812 E Main St
- 625 E Main St
- 624 E Main St
- 731 E Main St
- 806 Outer Gray St
- 212 Peachtree St
- 207 Peachtree St
- 626 Outer Gray St
- 625 Outer Gray St
Your Personal Tour Guide
Ask me questions while you tour the home.