Estimated Value: $450,000 - $856,297
3
Beds
4
Baths
4,808
Sq Ft
$128/Sq Ft
Est. Value
About This Home
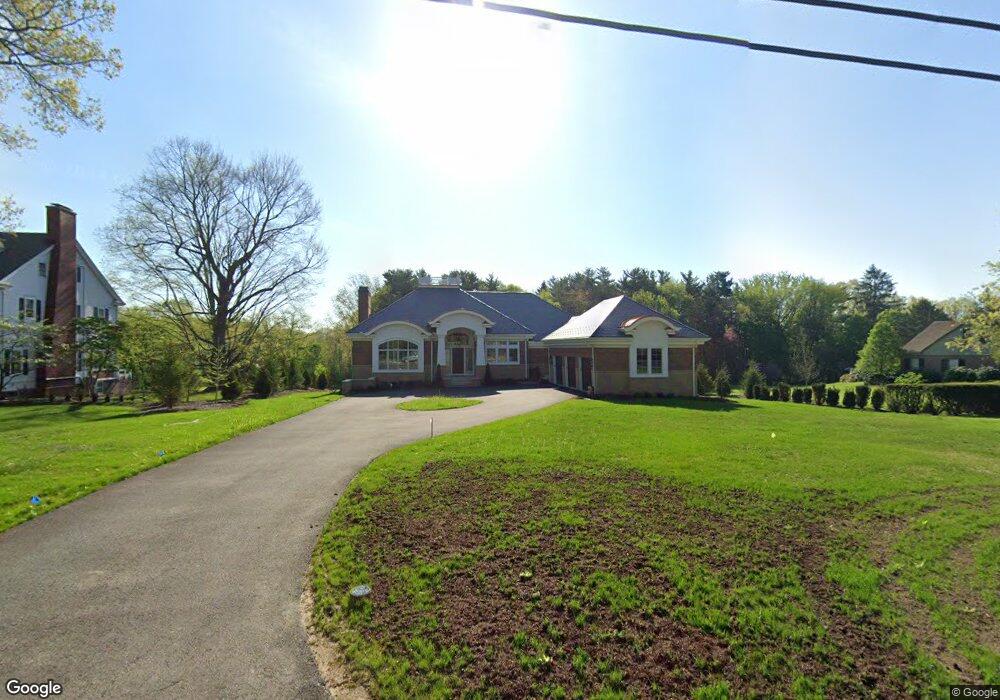
This home is located at 638 Highland Ave, Salem, OH 44460 and is currently estimated at $617,432, approximately $128 per square foot. 638 Highland Ave is a home located in Columbiana County with nearby schools including Reilly Elementary School, Buckeye Elementary School, and Salem Junior High School.
Ownership History
Date
Name
Owned For
Owner Type
Purchase Details
Closed on
Sep 9, 2021
Sold by
Mcculloch Jean Harry and Mcculloch Robert S
Bought by
Mcculloch Robert Spittal and Th Erobert Spittal
Current Estimated Value
Purchase Details
Closed on
Feb 18, 2002
Sold by
Riley Peter J and Riley Elizabeth B
Bought by
Brennan Riley Peter J and Brennan Riley Elizabeth
Purchase Details
Closed on
May 24, 2000
Sold by
Riley Peter J
Bought by
Riley Peter J and Riley Elizabeth B
Purchase Details
Closed on
Jul 30, 1999
Sold by
Riley Kathryn R
Bought by
Riley Peter J
Purchase Details
Closed on
Jul 7, 1999
Sold by
Riley Matthew H
Bought by
Riley Peter J
Purchase Details
Closed on
Jul 6, 1999
Sold by
Riley James M
Bought by
Riley Peter J
Purchase Details
Closed on
Jun 30, 1999
Sold by
Estate Of Polly S Riley
Bought by
Riley Peter J and Riley James M
Create a Home Valuation Report for This Property
The Home Valuation Report is an in-depth analysis detailing your home's value as well as a comparison with similar homes in the area
Home Values in the Area
Average Home Value in this Area
Purchase History
| Date | Buyer | Sale Price | Title Company |
|---|---|---|---|
| Mcculloch Robert Spittal | $200,000 | None Available | |
| Brennan Riley Peter J | -- | -- | |
| Riley Peter J | -- | -- | |
| Riley Peter J | $38,800 | -- | |
| Riley Peter J | $38,800 | -- | |
| Riley Peter J | $38,800 | -- | |
| Riley Peter J | -- | -- |
Source: Public Records
Tax History Compared to Growth
Tax History
| Year | Tax Paid | Tax Assessment Tax Assessment Total Assessment is a certain percentage of the fair market value that is determined by local assessors to be the total taxable value of land and additions on the property. | Land | Improvement |
|---|---|---|---|---|
| 2024 | $536 | $290,260 | $13,650 | $276,610 |
| 2023 | $537 | $87,360 | $13,650 | $73,710 |
| 2022 | $2,324 | $63,840 | $13,650 | $50,190 |
| 2021 | $2,281 | $57,160 | $13,690 | $43,470 |
| 2020 | $2,300 | $57,160 | $13,690 | $43,470 |
| 2019 | $2,300 | $57,160 | $13,690 | $43,470 |
| 2018 | $2,187 | $51,950 | $12,430 | $39,520 |
| 2017 | $2,185 | $51,950 | $12,430 | $39,520 |
| 2016 | $2,168 | $52,160 | $10,470 | $41,690 |
| 2015 | $2,213 | $52,160 | $10,470 | $41,690 |
| 2014 | $2,178 | $52,160 | $10,470 | $41,690 |
Source: Public Records
Map
Nearby Homes
- 512 N Union Ave
- 402 Highland Ave
- 401 Highland Ave
- 530 Hawley Ave
- 973 E 6th St
- 1273 E State St
- 1440 E 10th St
- 1408 E Pershing St
- 927 E 6th St
- 194 Park Ave
- 1255 E 11th St
- 879 E 4th St
- 339 S Union Ave
- 1160 Highland Ave
- 442 Washington St
- 592 N Lincoln Ave
- 400 N Madison Ave
- 3357 Ohio 9
- 675 E 8th St
- 676 E 3rd St Unit 684
- 700 Highland Ave
- 700 Highland Ave Unit 740
- 2171 Painter Rd
- 2153 Painter Rd
- 2137 Painter Rd
- 566 Highland Ave
- 714 Highland Ave
- 625 Highland Ave
- 575 Highland Ave
- 687 Highland Ave
- 750 Highland Ave
- 500 Highland Ave
- 606 N Union Ave
- 752 Highland Ave
- 752 Highland Ave
- 545 Highland Ave
- 545 Highland Ave
- 743 Highland Ave
- 570 Highland Ave
- 450 Highland Ave