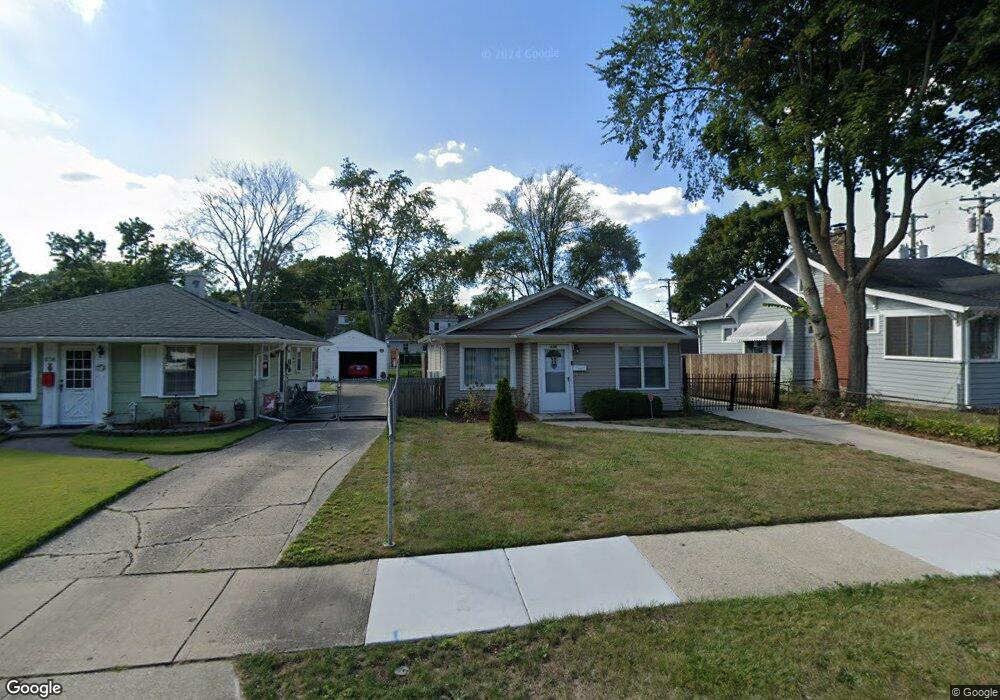
638 Judge Ave Waukegan, IL 60085
Lorraine Terrace NeighborhoodEstimated Value: $180,000 - $195,000
2
Beds
1
Bath
918
Sq Ft
$204/Sq Ft
Est. Value
About This Home
This home is located at 638 Judge Ave, Waukegan, IL 60085 and is currently estimated at $187,369, approximately $204 per square foot. 638 Judge Ave is a home located in Lake County with nearby schools including Hyde Park Elementary School, Miguel Juarez Middle School, and Waukegan High School.
Ownership History
Date
Name
Owned For
Owner Type
Purchase Details
Closed on
Jul 9, 2013
Sold by
Pacheco Francisco and Catu Jessica
Bought by
Pacheco Francisco and Pacheco Jesica
Current Estimated Value
Home Financials for this Owner
Home Financials are based on the most recent Mortgage that was taken out on this home.
Original Mortgage
$86,636
Outstanding Balance
$40,984
Interest Rate
3.37%
Mortgage Type
FHA
Estimated Equity
$146,385
Purchase Details
Closed on
Oct 11, 2002
Sold by
Harris Linda A
Bought by
Pacheco Francisco and Catu Jessica
Home Financials for this Owner
Home Financials are based on the most recent Mortgage that was taken out on this home.
Original Mortgage
$102,583
Interest Rate
6.25%
Mortgage Type
FHA
Purchase Details
Closed on
Jun 16, 2000
Sold by
Kennedy David A and Estate Of Katherine J Kennedy
Bought by
Harris Linda A
Home Financials for this Owner
Home Financials are based on the most recent Mortgage that was taken out on this home.
Original Mortgage
$89,658
Interest Rate
8.56%
Mortgage Type
VA
Create a Home Valuation Report for This Property
The Home Valuation Report is an in-depth analysis detailing your home's value as well as a comparison with similar homes in the area
Home Values in the Area
Average Home Value in this Area
Purchase History
| Date | Buyer | Sale Price | Title Company |
|---|---|---|---|
| Pacheco Francisco | -- | Carrington Title Partners Ll | |
| Pacheco Francisco | $103,500 | -- | |
| Harris Linda A | $87,900 | -- |
Source: Public Records
Mortgage History
| Date | Status | Borrower | Loan Amount |
|---|---|---|---|
| Open | Pacheco Francisco | $86,636 | |
| Previous Owner | Pacheco Francisco | $102,583 | |
| Previous Owner | Harris Linda A | $89,658 |
Source: Public Records
Tax History Compared to Growth
Tax History
| Year | Tax Paid | Tax Assessment Tax Assessment Total Assessment is a certain percentage of the fair market value that is determined by local assessors to be the total taxable value of land and additions on the property. | Land | Improvement |
|---|---|---|---|---|
| 2024 | $3,063 | $45,217 | $10,011 | $35,206 |
| 2023 | $2,947 | $40,483 | $8,963 | $31,520 |
| 2022 | $2,947 | $36,145 | $8,170 | $27,975 |
| 2021 | $2,681 | $31,719 | $7,696 | $24,023 |
| 2020 | $2,670 | $29,550 | $7,170 | $22,380 |
| 2019 | $2,634 | $27,078 | $6,570 | $20,508 |
| 2018 | $2,426 | $25,143 | $7,748 | $17,395 |
| 2017 | $2,311 | $22,245 | $6,855 | $15,390 |
| 2016 | $2,060 | $19,330 | $5,957 | $13,373 |
| 2015 | $1,909 | $17,301 | $5,332 | $11,969 |
| 2014 | $2,143 | $18,207 | $4,671 | $13,536 |
| 2012 | $2,876 | $19,724 | $5,060 | $14,664 |
Source: Public Records
Map
Nearby Homes
- 824 N Butrick St
- 1213 Grand Ave
- 968 Judge Ave
- 1109 Massena Ave
- 1005 N Lewis Ave
- 1000 Pine St
- 1023 N Elmwood Ave
- 2115 Lydia St
- 615 Tiffany Dr
- 917 N Linden Ave
- 1038 Indiana Ave
- 1117 Judge Ave
- 132 Dorchester Ct
- 1105 Woodlawn Cir
- 1504 W Glen Flora Ave
- 511 Chestnut St
- 620 N Poplar St
- 702 Franklin St
- 522 N Poplar St
- 428 N Poplar St
- 636 Judge Ave
- 640 Judge Ave
- 634 Judge Ave
- 632 Judge Ave
- 635 Lorraine Ave
- 639 Lorraine Ave
- 631 Lorraine Ave
- 628 Judge Ave
- 627 Lorraine Ave
- 641 Lorraine Ave
- 626 Judge Ave
- 625 Lorraine Ave
- 653 Judge Ave
- 645 Judge Ave
- 651 Judge Ave
- 1535 Grand Ave
- 622 Judge Ave
- 639 Judge Ave
- 623 Lorraine Ave
- 633 Judge Ave