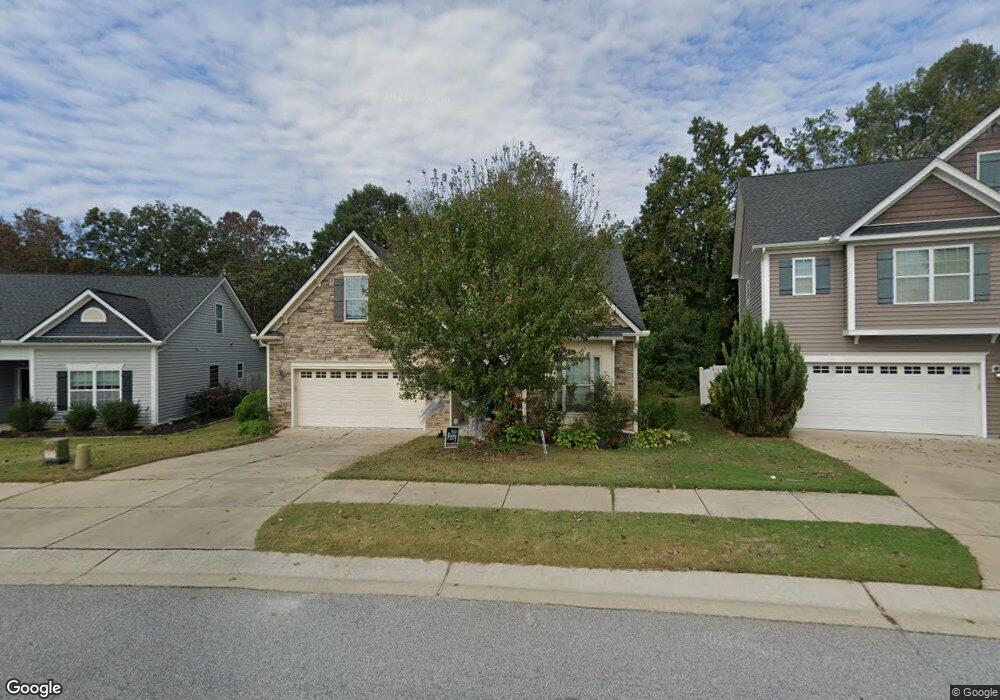
638 Lone Pine Loop Fuquay Varina, NC 27526
Estimated Value: $486,000 - $528,796
4
Beds
3
Baths
3,072
Sq Ft
$167/Sq Ft
Est. Value
About This Home
This home is located at 638 Lone Pine Loop, Fuquay Varina, NC 27526 and is currently estimated at $512,699, approximately $166 per square foot. 638 Lone Pine Loop is a home located in Wake County with nearby schools including Fuquay-Varina High, Achievement Charter Academy, and Southern Wake Academy.
Ownership History
Date
Name
Owned For
Owner Type
Purchase Details
Closed on
Mar 31, 2023
Sold by
Volz Meek Jane
Bought by
Volpe Brenan
Current Estimated Value
Home Financials for this Owner
Home Financials are based on the most recent Mortgage that was taken out on this home.
Original Mortgage
$470,250
Outstanding Balance
$456,497
Interest Rate
6.32%
Mortgage Type
New Conventional
Estimated Equity
$56,202
Purchase Details
Closed on
May 18, 2015
Sold by
Royal Oaks Building Group Llc
Bought by
Meek Jane Volz
Purchase Details
Closed on
Nov 18, 2014
Sold by
Hrb Development Llc
Bought by
Royal Oaks Building Group Llc
Home Financials for this Owner
Home Financials are based on the most recent Mortgage that was taken out on this home.
Original Mortgage
$225,500
Interest Rate
4.26%
Mortgage Type
Construction
Create a Home Valuation Report for This Property
The Home Valuation Report is an in-depth analysis detailing your home's value as well as a comparison with similar homes in the area
Home Values in the Area
Average Home Value in this Area
Purchase History
| Date | Buyer | Sale Price | Title Company |
|---|---|---|---|
| Volpe Brenan | $495,000 | -- | |
| Meek Jane Volz | $308,500 | None Available | |
| Royal Oaks Building Group Llc | $60,000 | None Available |
Source: Public Records
Mortgage History
| Date | Status | Borrower | Loan Amount |
|---|---|---|---|
| Open | Volpe Brenan | $470,250 | |
| Previous Owner | Royal Oaks Building Group Llc | $225,500 |
Source: Public Records
Tax History
| Year | Tax Paid | Tax Assessment Tax Assessment Total Assessment is a certain percentage of the fair market value that is determined by local assessors to be the total taxable value of land and additions on the property. | Land | Improvement |
|---|---|---|---|---|
| 2025 | $4,684 | $532,961 | $100,000 | $432,961 |
| 2024 | $4,665 | $532,961 | $100,000 | $432,961 |
Source: Public Records
Map
Nearby Homes
- 610 Silk Tree Trace
- 1268 Valley Dale Dr
- 825 Buckner Ct
- 1256 Valley Dale Dr
- 419 Lone Pine Loop
- 758 Sycamore Springs Dr
- 916 Bridlemine Dr
- 808 Red Oak Tree Dr
- 710 Tibumoll Ln
- 1004 Magnolia Farm Way
- 509 Timber Meadow Lake Dr
- 921 Stable Fern Dr
- 629 W Academy St
- 729 Leatherstone Ln
- 900 Cricket Knoll Rd
- 717 Near Post Dr
- 513 Wagstaff Rd
- 624 Wagstaff Rd
- 365 Maddox Dr
- 1124 Summer Daisy Cir
- 636 Lone Pine Loop
- 640 Lone Pine Loop
- 632 Lone Pine Loop
- 700 Lone Pine Loop
- 626 Lone Pine Loop
- 702 Lone Pine Loop
- 706 Lone Pine Loop
- 623 Lone Pine Loop
- 618 Lone Pine Loop
- 705 Lone Pine Loop
- 710 Lone Pine Loop
- 709 Lone Pine Loop
- 612 Lone Pine Loop
- 619 Lone Pine Loop
- 929 Sequoia Ridge Dr
- 608 Lone Pine Loop
- 613 Lone Pine Loop
- 892 Bartek Ct
- 924 Sequoia Ridge Dr
- 925 Sequoia Ridge Dr
Your Personal Tour Guide
Ask me questions while you tour the home.