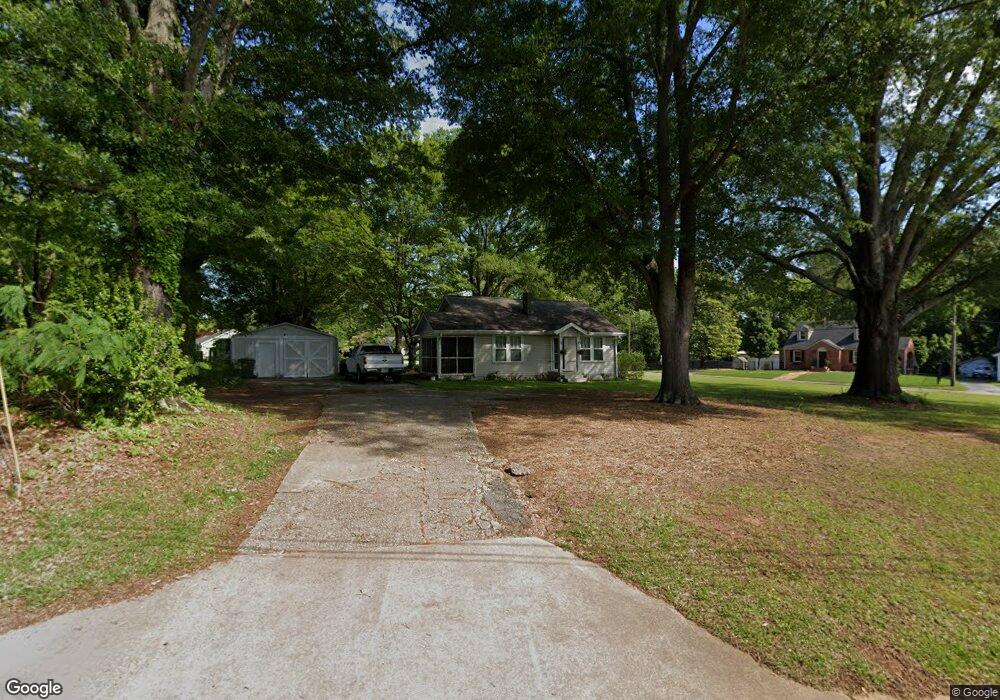
638 Longview St Carrollton, GA 30117
Estimated Value: $235,710 - $258,000
2
Beds
1
Bath
990
Sq Ft
$249/Sq Ft
Est. Value
About This Home
This home is located at 638 Longview St, Carrollton, GA 30117 and is currently estimated at $246,428, approximately $248 per square foot. 638 Longview St is a home located in Carroll County with nearby schools including Carrollton Elementary School, Carrollton Upper Elementary School, and Carrollton Middle School.
Ownership History
Date
Name
Owned For
Owner Type
Purchase Details
Closed on
Dec 31, 2020
Sold by
Duggar Donald W
Bought by
Sheilds Kenneth Warren and Sheilds Natalie Marie
Current Estimated Value
Home Financials for this Owner
Home Financials are based on the most recent Mortgage that was taken out on this home.
Original Mortgage
$127,000
Outstanding Balance
$113,348
Interest Rate
2.71%
Mortgage Type
New Conventional
Estimated Equity
$133,080
Purchase Details
Closed on
Oct 26, 2012
Sold by
Conerly Candy
Bought by
Duggar Donald W
Home Financials for this Owner
Home Financials are based on the most recent Mortgage that was taken out on this home.
Original Mortgage
$61,900
Interest Rate
3.42%
Mortgage Type
New Conventional
Purchase Details
Closed on
Mar 27, 1995
Bought by
Phillips Earl
Purchase Details
Closed on
Jul 6, 1989
Bought by
Brock E Ann
Create a Home Valuation Report for This Property
The Home Valuation Report is an in-depth analysis detailing your home's value as well as a comparison with similar homes in the area
Home Values in the Area
Average Home Value in this Area
Purchase History
| Date | Buyer | Sale Price | Title Company |
|---|---|---|---|
| Sheilds Kenneth Warren | $170,000 | -- | |
| Duggar Donald W | $63,900 | -- | |
| Phillips Earl | $56,500 | -- | |
| Brock E Ann | $37,500 | -- |
Source: Public Records
Mortgage History
| Date | Status | Borrower | Loan Amount |
|---|---|---|---|
| Open | Sheilds Kenneth Warren | $127,000 | |
| Previous Owner | Duggar Donald W | $61,900 |
Source: Public Records
Tax History Compared to Growth
Tax History
| Year | Tax Paid | Tax Assessment Tax Assessment Total Assessment is a certain percentage of the fair market value that is determined by local assessors to be the total taxable value of land and additions on the property. | Land | Improvement |
|---|---|---|---|---|
| 2024 | $2,304 | $84,334 | $49,639 | $34,695 |
| 2023 | $2,304 | $81,377 | $49,640 | $31,737 |
| 2022 | $1,407 | $48,187 | $33,093 | $15,094 |
| 2021 | $1,100 | $37,680 | $24,493 | $13,187 |
| 2020 | $1,060 | $36,283 | $24,493 | $11,790 |
| 2019 | $1,041 | $35,309 | $24,493 | $10,816 |
| 2018 | $1,030 | $34,437 | $24,493 | $9,944 |
| 2017 | $1,003 | $33,344 | $23,400 | $9,944 |
| 2016 | $1,009 | $33,344 | $23,400 | $9,944 |
| 2015 | $761 | $24,632 | $12,800 | $11,832 |
| 2014 | $764 | $24,632 | $12,800 | $11,832 |
Source: Public Records
Map
Nearby Homes
- 516 Longview St
- 105 Haygood Place
- 141 Bowen St
- 142 Griffin Dr
- 0 Hwy 27 None N
- 219 Broad St
- 117 Orion Terrace
- 308 Old Mill Dr
- 166 Maple St
- 98 Millstream Ct
- 160 Watson St
- 27 South St
- 74 Old Mill Ct
- 109 S Park St
- 223 Sunset Blvd
- 301 Bradley St
- 301 C4 Bradley St
- 1818 Maple St
- 423 Clifton Terrace
- 105 Mara St
- 630 Longview St
- 109 South Blvd
- 120 South Blvd
- 115 South Blvd
- 105 South Blvd
- 0 Hwy 27 Hwy S Unit 7389194
- 0 Hwy 27 Hwy S Unit 7569745
- 0 Hwy 27 Hwy S Unit 8930460
- 0 Hwy 27 Hwy S Unit 10260968
- 0 Hwy 27 Hwy S Unit 144062
- 0 Hwy 27 Hwy S Unit 144146
- 0 Hwy 27 Hwy S Unit 7195452
- 0 Hwy 27 Hwy S Unit 10143695
- 0 Hwy 27 Hwy S Unit 7188319
- 0 Hwy 27 Hwy S Unit 10136795
- 0 Hwy 27 Hwy S Unit 7018754
- 0 Hwy 27 Hwy S Unit 7018738
- 0 Hwy 27 Hwy S Unit 7018767
- TRACT 27 South 5 Hwy
- TRACT 27 South 4 Hwy