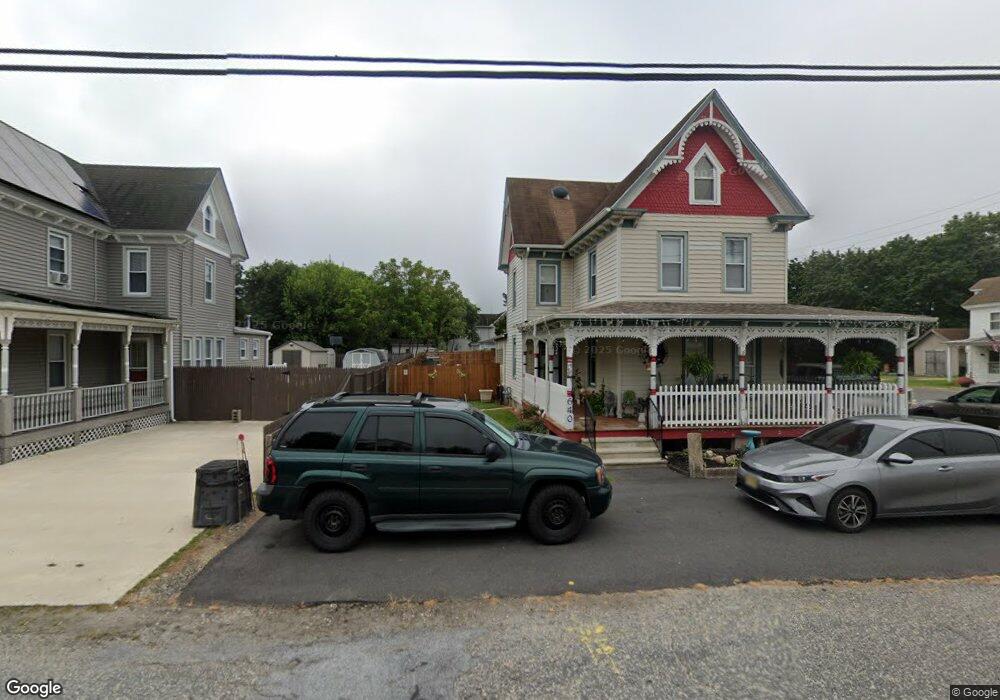
638 Main St Leesburg, NJ 08327
Maurice River NeighborhoodEstimated Value: $220,782 - $309,000
--
Bed
--
Bath
1,360
Sq Ft
$207/Sq Ft
Est. Value
About This Home
This home is located at 638 Main St, Leesburg, NJ 08327 and is currently estimated at $280,946, approximately $206 per square foot. 638 Main St is a home with nearby schools including Maurice River Township Elementary School.
Ownership History
Date
Name
Owned For
Owner Type
Purchase Details
Closed on
May 12, 2015
Sold by
Creamer Kelly J and Creamer Barry L
Bought by
Creamer Kelly J
Current Estimated Value
Purchase Details
Closed on
Jun 1, 1996
Sold by
Tozer Alfred L
Bought by
Creamer Barry and Creamer Paula
Home Financials for this Owner
Home Financials are based on the most recent Mortgage that was taken out on this home.
Original Mortgage
$62,934
Interest Rate
7.97%
Mortgage Type
FHA
Create a Home Valuation Report for This Property
The Home Valuation Report is an in-depth analysis detailing your home's value as well as a comparison with similar homes in the area
Home Values in the Area
Average Home Value in this Area
Purchase History
| Date | Buyer | Sale Price | Title Company |
|---|---|---|---|
| Creamer Kelly J | -- | None Available | |
| Creamer Barry | $63,000 | Commonwealth Land Title Ins |
Source: Public Records
Mortgage History
| Date | Status | Borrower | Loan Amount |
|---|---|---|---|
| Previous Owner | Creamer Barry | $62,934 |
Source: Public Records
Tax History Compared to Growth
Tax History
| Year | Tax Paid | Tax Assessment Tax Assessment Total Assessment is a certain percentage of the fair market value that is determined by local assessors to be the total taxable value of land and additions on the property. | Land | Improvement |
|---|---|---|---|---|
| 2025 | $3,968 | $137,100 | $26,500 | $110,600 |
| 2024 | $3,968 | $137,100 | $26,500 | $110,600 |
| 2023 | $4,027 | $137,100 | $26,500 | $110,600 |
| 2022 | $4,040 | $137,100 | $26,500 | $110,600 |
| 2021 | $3,787 | $137,100 | $26,500 | $110,600 |
| 2020 | $3,875 | $134,100 | $26,500 | $107,600 |
| 2019 | $3,787 | $134,100 | $26,500 | $107,600 |
| 2018 | $3,697 | $134,100 | $26,500 | $107,600 |
| 2017 | $3,674 | $134,100 | $26,500 | $107,600 |
| 2016 | $3,576 | $134,100 | $26,500 | $107,600 |
| 2015 | $3,546 | $134,100 | $26,500 | $107,600 |
| 2014 | -- | $134,100 | $26,500 | $107,600 |
Source: Public Records
Map
Nearby Homes