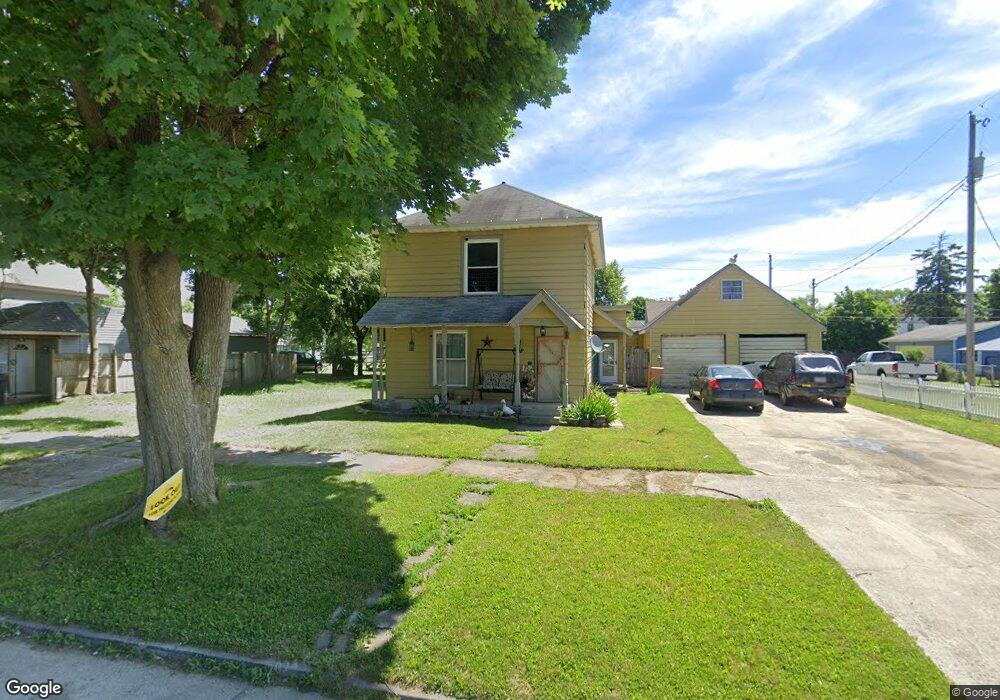
638 Maple St Fostoria, OH 44830
Estimated Value: $94,000 - $162,000
3
Beds
1
Bath
1,848
Sq Ft
$69/Sq Ft
Est. Value
About This Home
This home is located at 638 Maple St, Fostoria, OH 44830 and is currently estimated at $126,815, approximately $68 per square foot. 638 Maple St is a home located in Seneca County with nearby schools including Fostoria Intermediate Elementary School and Fostoria Junior/Senior High School.
Ownership History
Date
Name
Owned For
Owner Type
Purchase Details
Closed on
Oct 12, 2007
Sold by
Key Bank Na
Bought by
Simpson Mara D
Current Estimated Value
Purchase Details
Closed on
Apr 10, 2007
Sold by
Kleinmark Rachel and Kleinmark Gregg
Bought by
Key Bank Na
Purchase Details
Closed on
Aug 14, 2000
Bought by
Grine Rachel
Purchase Details
Closed on
May 3, 1999
Sold by
Jones Nazek Y
Bought by
First Union National Bank
Create a Home Valuation Report for This Property
The Home Valuation Report is an in-depth analysis detailing your home's value as well as a comparison with similar homes in the area
Home Values in the Area
Average Home Value in this Area
Purchase History
| Date | Buyer | Sale Price | Title Company |
|---|---|---|---|
| Simpson Mara D | $10,500 | None Available | |
| Key Bank Na | $26,667 | None Available | |
| Grine Rachel | $30,000 | -- | |
| First Union National Bank | -- | -- |
Source: Public Records
Tax History Compared to Growth
Tax History
| Year | Tax Paid | Tax Assessment Tax Assessment Total Assessment is a certain percentage of the fair market value that is determined by local assessors to be the total taxable value of land and additions on the property. | Land | Improvement |
|---|---|---|---|---|
| 2024 | $1,763 | $33,030 | $4,290 | $28,740 |
| 2023 | $2,714 | $33,030 | $4,290 | $28,740 |
| 2022 | $1,623 | $26,950 | $3,560 | $23,390 |
| 2021 | $1,656 | $26,950 | $3,560 | $23,390 |
| 2020 | $3,536 | $26,943 | $3,556 | $23,387 |
| 2019 | $1,581 | $25,347 | $3,430 | $21,917 |
| 2018 | $1,611 | $25,347 | $3,430 | $21,917 |
| 2017 | $1,609 | $25,347 | $3,430 | $21,917 |
| 2016 | $1,318 | $22,964 | $3,654 | $19,310 |
| 2015 | $2,045 | $22,964 | $3,654 | $19,310 |
| 2014 | $3,610 | $22,964 | $3,654 | $19,310 |
| 2013 | $4,602 | $24,963 | $3,973 | $20,990 |
Source: Public Records
Map
Nearby Homes
- 633 Maple St
- 540 N Poplar St
- 220 E High St
- 723 N Union St
- 931 N Union St
- 520 N Union St
- 207 W Culbertson St
- 827 Buckley St
- 711 Circle Dr
- 321 Mcdougal St
- 703 Glenwood Ave
- 892 N Countyline St
- 900 N Countyline St
- 481 Beverly Dr
- 1324 N Union St
- 203 N Union St
- 435 Park Ave
- 412 E Center St
- 375 Thomas St
- 603 N Vine St