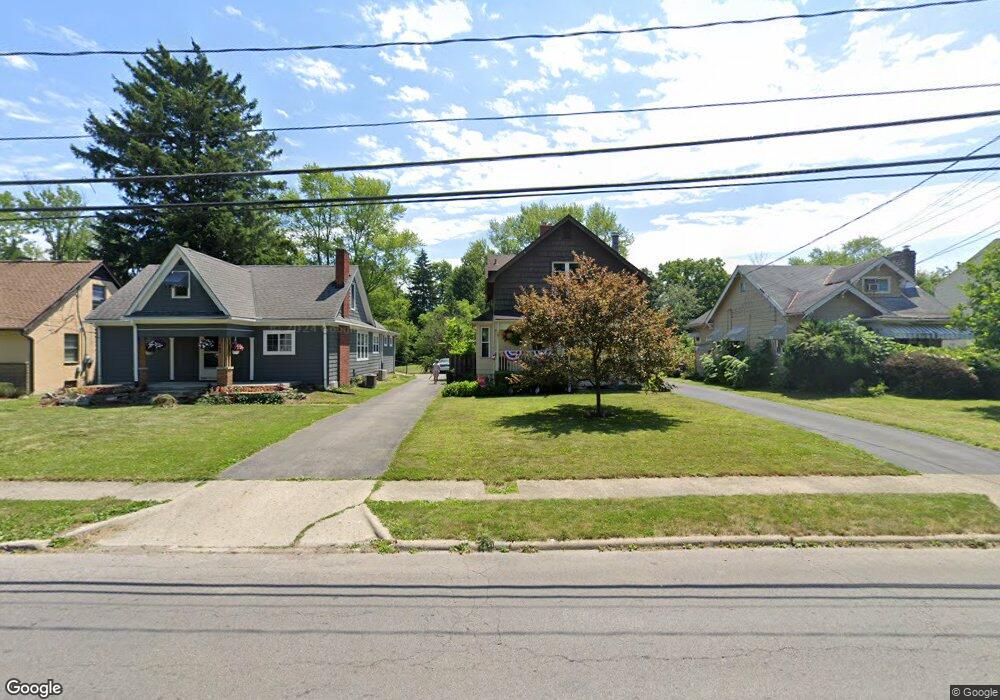
638 Maplewood Ave Columbus, OH 43213
Estimated Value: $208,000 - $232,000
3
Beds
1
Bath
1,472
Sq Ft
$148/Sq Ft
Est. Value
About This Home
This home is located at 638 Maplewood Ave, Columbus, OH 43213 and is currently estimated at $218,304, approximately $148 per square foot. 638 Maplewood Ave is a home located in Franklin County with nearby schools including Beechwood Elementary School, Etna Road Elementary School, and Rosemore Middle School.
Ownership History
Date
Name
Owned For
Owner Type
Purchase Details
Closed on
Jul 18, 2023
Sold by
Sherman Jon G and Sherman Alice E
Bought by
Sherman Jon G and Sherman Alice E
Current Estimated Value
Purchase Details
Closed on
Jul 7, 2023
Sold by
Sherman Jon G and Sherman Alice E
Bought by
Sherman Jon G and Sherman Alice E
Purchase Details
Closed on
May 8, 1979
Bought by
Sherman Jon G
Create a Home Valuation Report for This Property
The Home Valuation Report is an in-depth analysis detailing your home's value as well as a comparison with similar homes in the area
Home Values in the Area
Average Home Value in this Area
Purchase History
| Date | Buyer | Sale Price | Title Company |
|---|---|---|---|
| Sherman Jon G | -- | None Listed On Document | |
| Sherman Jon G | -- | None Listed On Document | |
| Sherman Jon G | $48,000 | -- |
Source: Public Records
Tax History Compared to Growth
Tax History
| Year | Tax Paid | Tax Assessment Tax Assessment Total Assessment is a certain percentage of the fair market value that is determined by local assessors to be the total taxable value of land and additions on the property. | Land | Improvement |
|---|---|---|---|---|
| 2024 | $2,618 | $69,690 | $14,000 | $55,690 |
| 2023 | $2,627 | $69,690 | $14,000 | $55,690 |
| 2022 | $1,837 | $40,920 | $6,090 | $34,830 |
| 2021 | $1,725 | $40,920 | $6,090 | $34,830 |
| 2020 | $1,708 | $40,920 | $6,090 | $34,830 |
| 2019 | $1,443 | $32,380 | $4,870 | $27,510 |
| 2018 | $1,420 | $32,380 | $4,870 | $27,510 |
| 2017 | $1,394 | $32,380 | $4,870 | $27,510 |
| 2016 | $1,358 | $29,540 | $4,340 | $25,200 |
| 2015 | $1,369 | $29,540 | $4,340 | $25,200 |
| 2014 | $1,370 | $29,540 | $4,340 | $25,200 |
| 2013 | $755 | $32,830 | $4,830 | $28,000 |
Source: Public Records
Map
Nearby Homes
- 3668 Washburn St
- 624 Collingwood Ave
- 576 Collingwood Ave
- 647 S Napoleon Ave
- 646 S Weyant Ave
- 523 S Napoleon Ave
- 526 Collingwood Ave
- 828 Ruby Ave
- 711 S Waverly St
- 561 S Hampton Rd
- 892 Ruby Ave
- 635 Elizabeth Ave
- 864 S Waverly St
- 891 S Weyant Ave Unit 893
- 3719 Elbern Ave
- 283 Maplewood Ave
- 842 S Hampton Rd
- 320 Collingwood Ave
- 789 Elizabeth Ave
- 3814 Elbern Ave
- 648 Maplewood Ave
- 634 Maplewood Ave
- 630 Maplewood Ave
- 654 Maplewood Ave
- 626 Maplewood Ave
- 660 Maplewood Ave
- 645 Maplewood Ave
- 635 Maplewood Ave
- 639 Maplewood Ave
- 625 Maplewood Ave
- 619 Maplewood Ave
- 612 Maplewood Ave
- 3619 Washburn St
- 665 Maplewood Ave
- 664 Maplewood Ave
- 605 Maplewood Ave
- 676 Maplewood Ave
- 671 Maplewood Ave
- 3623 Washburn St
- 677 Maplewood Ave