Estimated Value: $203,740 - $214,000
3
Beds
2
Baths
910
Sq Ft
$229/Sq Ft
Est. Value
About This Home
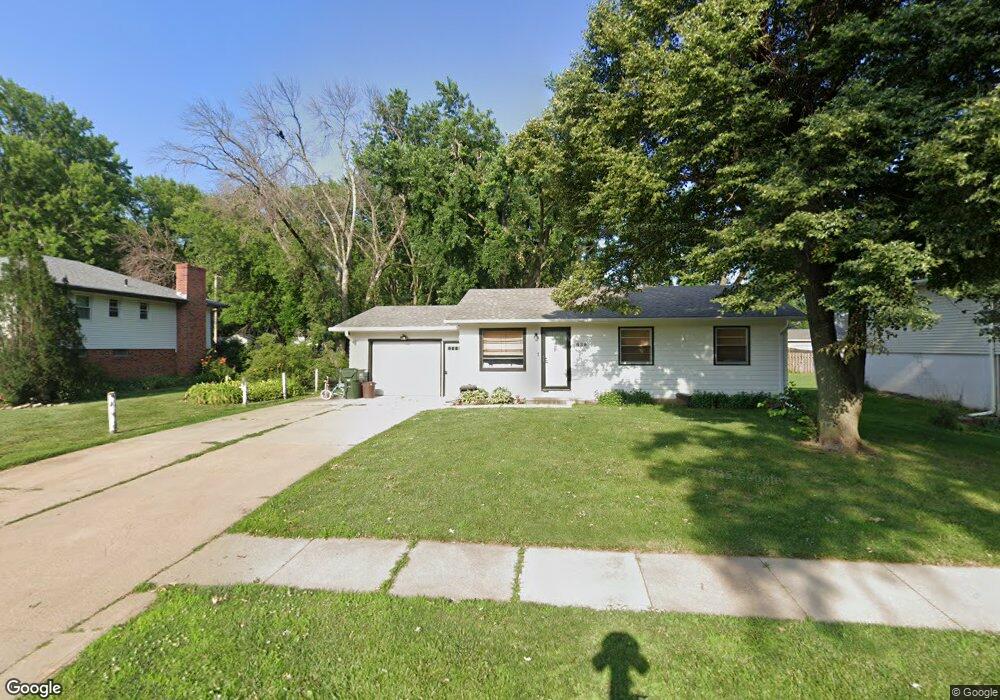
This home is located at 638 N 13th St, Blair, NE 68008 and is currently estimated at $208,185, approximately $228 per square foot. 638 N 13th St is a home located in Washington County with nearby schools including Blair High School and Blair Christian Academy.
Ownership History
Date
Name
Owned For
Owner Type
Purchase Details
Closed on
Jun 6, 2023
Sold by
Mclaughlin Grayce L
Bought by
Brooks Thomas J
Current Estimated Value
Purchase Details
Closed on
Dec 2, 2021
Sold by
Sundell Donald C and Sundell Jody K
Bought by
Olson Colby and Camden Anna
Home Financials for this Owner
Home Financials are based on the most recent Mortgage that was taken out on this home.
Original Mortgage
$147,250
Interest Rate
3.14%
Mortgage Type
New Conventional
Purchase Details
Closed on
Sep 30, 2014
Sold by
Truhlsen Rachel A and Estate Of Elzene Lundgren
Bought by
Sundell Donald C and Sundell Jody K
Home Financials for this Owner
Home Financials are based on the most recent Mortgage that was taken out on this home.
Original Mortgage
$60,000
Interest Rate
4.13%
Mortgage Type
Future Advance Clause Open End Mortgage
Create a Home Valuation Report for This Property
The Home Valuation Report is an in-depth analysis detailing your home's value as well as a comparison with similar homes in the area
Home Values in the Area
Average Home Value in this Area
Purchase History
| Date | Buyer | Sale Price | Title Company |
|---|---|---|---|
| Brooks Thomas J | $100,000 | None Listed On Document | |
| Olson Colby | $155,000 | Blair Abstract And Title Co | |
| Sundell Donald C | $42,000 | None Available | |
| Sundell Donald C | $41,777 | None Available |
Source: Public Records
Mortgage History
| Date | Status | Borrower | Loan Amount |
|---|---|---|---|
| Previous Owner | Olson Colby | $147,250 | |
| Previous Owner | Sundell Donald C | $60,000 |
Source: Public Records
Tax History Compared to Growth
Tax History
| Year | Tax Paid | Tax Assessment Tax Assessment Total Assessment is a certain percentage of the fair market value that is determined by local assessors to be the total taxable value of land and additions on the property. | Land | Improvement |
|---|---|---|---|---|
| 2025 | $1,671 | $152,635 | $21,050 | $131,585 |
| 2024 | $1,671 | $146,600 | $21,050 | $125,550 |
| 2023 | $2,088 | $134,045 | $21,050 | $112,995 |
| 2022 | $2,271 | $123,145 | $21,050 | $102,095 |
| 2021 | $2,139 | $113,655 | $21,050 | $92,605 |
| 2020 | $2,148 | $110,960 | $21,050 | $89,910 |
| 2019 | $2,087 | $103,380 | $21,050 | $82,330 |
| 2018 | $1,987 | $98,070 | $21,050 | $77,020 |
| 2017 | $1,840 | $93,970 | $21,050 | $72,920 |
| 2016 | $1,834 | $93,970 | $21,050 | $72,920 |
| 2015 | $1,729 | $89,635 | $21,050 | $68,585 |
| 2014 | $1,729 | $89,635 | $21,050 | $68,585 |
Source: Public Records
Map
Nearby Homes
- 1454 Nebraska St
- 1021 Mary Beth Cir
- 1013 Mary Beth Cir
- 354 E Baronage Dr
- 1704 State St
- 1427 Lincoln St
- 1307 Grant St Unit 1
- 1307 Grant St Unit 3
- 1307 Grant St Unit 2
- 1407 Grant St
- 1465 Grant St
- 1616 Grant St
- 1713 Lincoln St
- 215 S 17th St
- 2018 Northridge Cir
- 2041 Arbor Cir
- 1454 South St
- 1916 Lincoln St
- 2064 Washington St
- 1749 South St