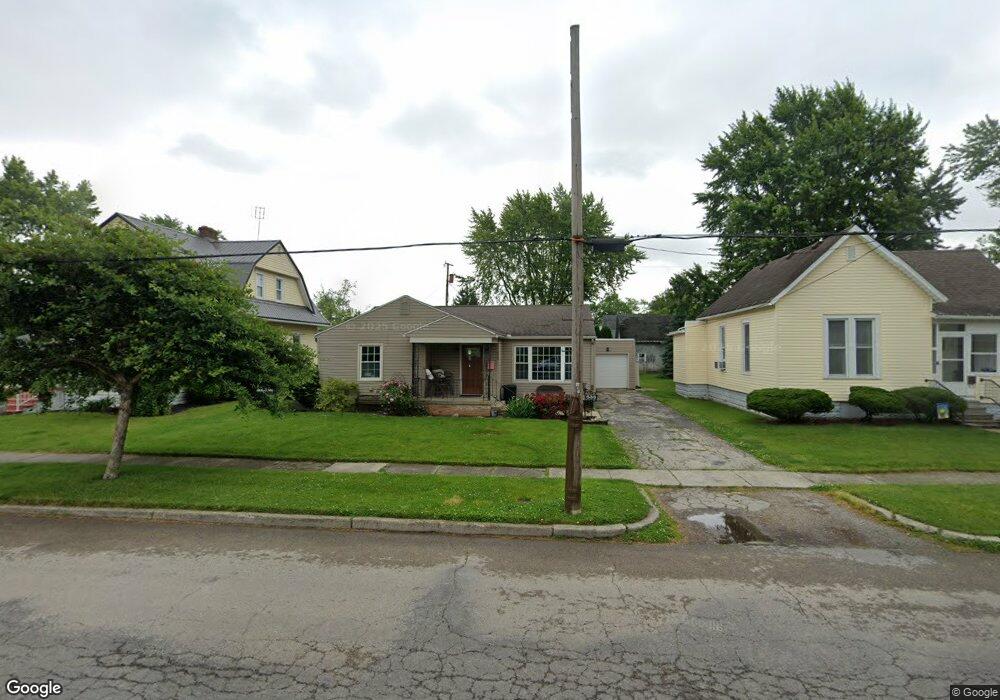
638 N Jefferson St van Wert, OH 45891
Estimated Value: $126,701 - $162,000
2
Beds
2
Baths
1,304
Sq Ft
$111/Sq Ft
Est. Value
About This Home
This home is located at 638 N Jefferson St, van Wert, OH 45891 and is currently estimated at $144,425, approximately $110 per square foot. 638 N Jefferson St is a home located in Van Wert County with nearby schools including Van Wert Early Childhood Center, Van Wert High School, and Lifelinks Community School.
Ownership History
Date
Name
Owned For
Owner Type
Purchase Details
Closed on
Jan 31, 2025
Sold by
Robey Betty B and Boroff Crystal
Bought by
Boroff Jason
Current Estimated Value
Home Financials for this Owner
Home Financials are based on the most recent Mortgage that was taken out on this home.
Original Mortgage
$66,748
Outstanding Balance
$66,525
Interest Rate
6.96%
Mortgage Type
FHA
Estimated Equity
$77,900
Purchase Details
Closed on
Oct 26, 2010
Sold by
Williams Sondra J
Bought by
Robey Betty B
Home Financials for this Owner
Home Financials are based on the most recent Mortgage that was taken out on this home.
Original Mortgage
$74,093
Interest Rate
4.37%
Mortgage Type
New Conventional
Purchase Details
Closed on
Jul 13, 1993
Bought by
Kaduk Frank J and Betty Jo
Create a Home Valuation Report for This Property
The Home Valuation Report is an in-depth analysis detailing your home's value as well as a comparison with similar homes in the area
Home Values in the Area
Average Home Value in this Area
Purchase History
| Date | Buyer | Sale Price | Title Company |
|---|---|---|---|
| Boroff Jason | $68,000 | None Listed On Document | |
| Robey Betty B | $71,500 | American Title Resources Inc | |
| Kaduk Frank J | $45,000 | -- |
Source: Public Records
Mortgage History
| Date | Status | Borrower | Loan Amount |
|---|---|---|---|
| Open | Boroff Jason | $66,748 | |
| Previous Owner | Robey Betty B | $74,093 | |
| Previous Owner | Williams Sondra J | $14,808 | |
| Previous Owner | Williams Sondra J | $6,000 |
Source: Public Records
Tax History Compared to Growth
Tax History
| Year | Tax Paid | Tax Assessment Tax Assessment Total Assessment is a certain percentage of the fair market value that is determined by local assessors to be the total taxable value of land and additions on the property. | Land | Improvement |
|---|---|---|---|---|
| 2024 | $706 | $29,820 | $3,590 | $26,230 |
| 2023 | $706 | $29,820 | $3,590 | $26,230 |
| 2022 | $614 | $23,790 | $2,390 | $21,400 |
| 2021 | $598 | $23,790 | $2,390 | $21,400 |
| 2020 | $905 | $23,790 | $2,390 | $21,400 |
| 2019 | $809 | $20,860 | $2,390 | $18,470 |
| 2018 | $790 | $20,860 | $2,390 | $18,470 |
| 2017 | $819 | $20,860 | $2,390 | $18,470 |
| 2016 | $798 | $22,370 | $2,390 | $19,980 |
| 2015 | $798 | $22,370 | $2,390 | $19,980 |
| 2014 | $789 | $22,370 | $2,390 | $19,980 |
| 2013 | $850 | $22,370 | $2,390 | $19,980 |
Source: Public Records
Map
Nearby Homes
- 668 N Washington St
- 304 Anderson Ave
- 142 Gleason Ave
- 656 N Market St
- 228 W 2nd St
- 331 North St
- 692 N Market St
- 517 N Walnut St
- 600 N Walnut St
- 623 N Cherry St
- 103 Bonnewitz Ave
- 409 N Cherry St
- 214 N Jefferson St
- 202 N Jefferson St
- 603 Pewterboy Ave
- 218 Burt St
- 829 Allingham St
- 706 Woodland Ave
- 902 Kear Rd
- 729 George St
- 636 N Jefferson St
- 640 N Jefferson St
- 643 N Washington St
- 664 N Jefferson St
- 639 N Washington St
- 632 N Jefferson St
- 649 N Washington St
- 661 N Washington St
- 666 N Jefferson St
- 633 N Washington St
- 628 N Jefferson St
- 667 N Washington St
- 637 N Jefferson St
- 625 N Washington St
- 631 N Jefferson St
- 700 N Jefferson St
- 619 N Washington St
- 679 N Washington St
- 704 N Jefferson St