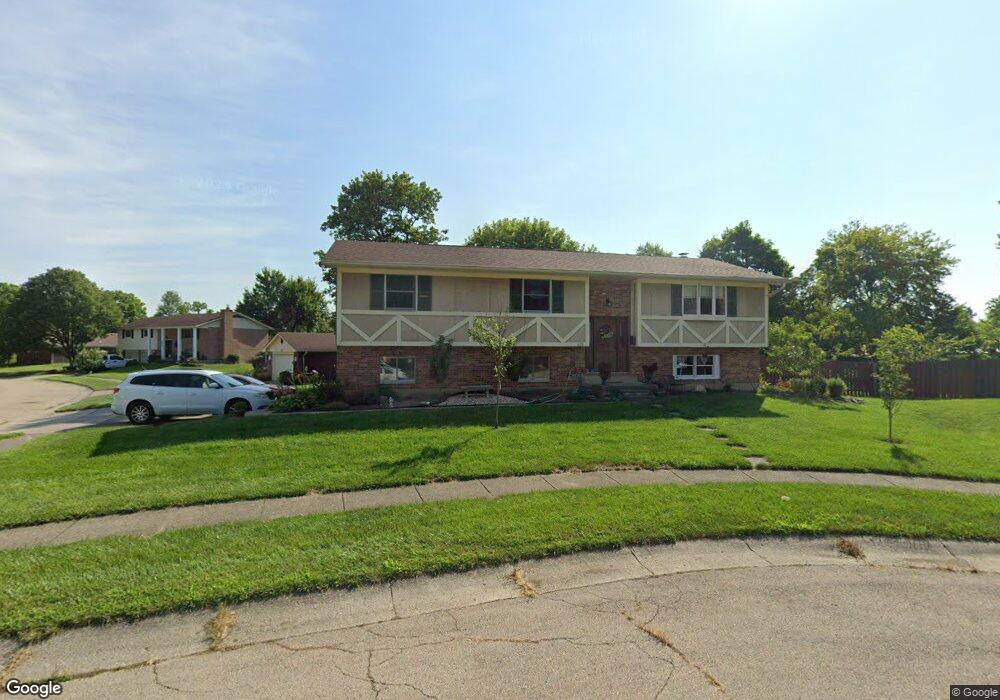
638 Pecos Ct Miamisburg, OH 45342
Estimated Value: $231,000 - $260,000
3
Beds
2
Baths
1,525
Sq Ft
$161/Sq Ft
Est. Value
About This Home
This home is located at 638 Pecos Ct, Miamisburg, OH 45342 and is currently estimated at $245,074, approximately $160 per square foot. 638 Pecos Ct is a home located in Montgomery County with nearby schools including Miamisburg High School.
Ownership History
Date
Name
Owned For
Owner Type
Purchase Details
Closed on
Mar 25, 2022
Sold by
Keys Larry D and Keys Kimberly K
Bought by
Keys Erika Rae and Keys Tyler J
Current Estimated Value
Home Financials for this Owner
Home Financials are based on the most recent Mortgage that was taken out on this home.
Original Mortgage
$133,000
Interest Rate
4.38%
Mortgage Type
New Conventional
Purchase Details
Closed on
Apr 14, 1998
Sold by
Cole Gary L and Cole Pamela K
Bought by
Keys Larry D and Keys Kimberly K
Home Financials for this Owner
Home Financials are based on the most recent Mortgage that was taken out on this home.
Original Mortgage
$118,000
Interest Rate
7.27%
Create a Home Valuation Report for This Property
The Home Valuation Report is an in-depth analysis detailing your home's value as well as a comparison with similar homes in the area
Home Values in the Area
Average Home Value in this Area
Purchase History
| Date | Buyer | Sale Price | Title Company |
|---|---|---|---|
| Keys Erika Rae | -- | None Listed On Document | |
| Keys Larry D | $125,900 | -- | |
| Keys Larry D | $125,900 | -- |
Source: Public Records
Mortgage History
| Date | Status | Borrower | Loan Amount |
|---|---|---|---|
| Previous Owner | Keys Erika Rae | $133,000 | |
| Previous Owner | Keys Larry D | $118,000 |
Source: Public Records
Tax History Compared to Growth
Tax History
| Year | Tax Paid | Tax Assessment Tax Assessment Total Assessment is a certain percentage of the fair market value that is determined by local assessors to be the total taxable value of land and additions on the property. | Land | Improvement |
|---|---|---|---|---|
| 2024 | $3,958 | $62,310 | $12,150 | $50,160 |
| 2023 | $3,958 | $62,310 | $12,150 | $50,160 |
| 2022 | $3,788 | $50,250 | $9,800 | $40,450 |
| 2021 | $3,350 | $50,250 | $9,800 | $40,450 |
| 2020 | $3,342 | $50,250 | $9,800 | $40,450 |
| 2019 | $3,491 | $43,400 | $9,800 | $33,600 |
| 2018 | $3,513 | $43,400 | $9,800 | $33,600 |
| 2017 | $3,504 | $43,400 | $9,800 | $33,600 |
| 2016 | $3,353 | $39,670 | $9,800 | $29,870 |
| 2015 | $3,319 | $39,670 | $9,800 | $29,870 |
| 2014 | $3,319 | $39,670 | $9,800 | $29,870 |
| 2012 | -- | $41,290 | $9,800 | $31,490 |
Source: Public Records
Map
Nearby Homes