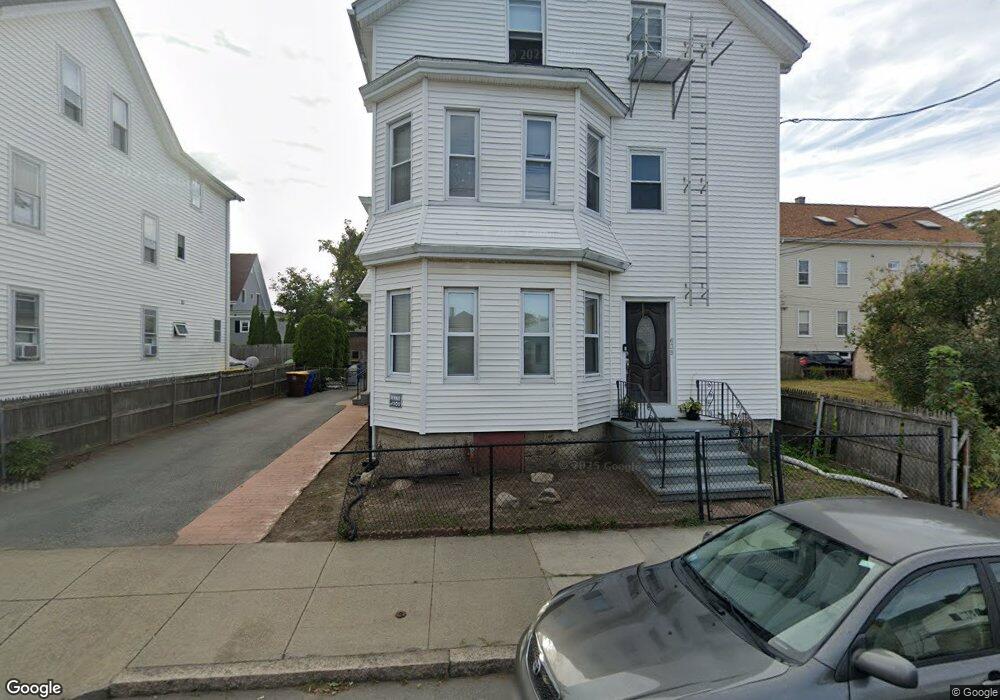
638 Robeson St Unit 3 Fall River, MA 02720
Bank Street NeighborhoodEstimated Value: $610,606 - $696,000
2
Beds
1
Bath
900
Sq Ft
$713/Sq Ft
Est. Value
About This Home
This home is located at 638 Robeson St Unit 3, Fall River, MA 02720 and is currently estimated at $641,402, approximately $712 per square foot. 638 Robeson St Unit 3 is a home located in Bristol County with nearby schools including Mary Fonseca Elementary School, Morton Middle School, and B M C Durfee High School.
Ownership History
Date
Name
Owned For
Owner Type
Purchase Details
Closed on
Oct 30, 1987
Sold by
Meridienne Rt
Bought by
Costa Eduardo J
Current Estimated Value
Home Financials for this Owner
Home Financials are based on the most recent Mortgage that was taken out on this home.
Original Mortgage
$141,300
Interest Rate
10.97%
Mortgage Type
Purchase Money Mortgage
Create a Home Valuation Report for This Property
The Home Valuation Report is an in-depth analysis detailing your home's value as well as a comparison with similar homes in the area
Home Values in the Area
Average Home Value in this Area
Purchase History
| Date | Buyer | Sale Price | Title Company |
|---|---|---|---|
| Costa Eduardo J | $157,000 | -- |
Source: Public Records
Mortgage History
| Date | Status | Borrower | Loan Amount |
|---|---|---|---|
| Open | Costa Eduardo J | $131,200 | |
| Closed | Costa Eduardo J | $148,000 | |
| Closed | Costa Eduardo J | $12,550 | |
| Closed | Costa Eduardo J | $141,300 |
Source: Public Records
Tax History
| Year | Tax Paid | Tax Assessment Tax Assessment Total Assessment is a certain percentage of the fair market value that is determined by local assessors to be the total taxable value of land and additions on the property. | Land | Improvement |
|---|---|---|---|---|
| 2025 | $6,000 | $524,000 | $116,100 | $407,900 |
| 2024 | $5,758 | $501,100 | $113,800 | $387,300 |
| 2023 | $5,182 | $422,300 | $102,500 | $319,800 |
| 2022 | $4,600 | $364,500 | $96,700 | $267,800 |
| 2021 | $4,221 | $305,200 | $92,400 | $212,800 |
| 2020 | $3,779 | $261,500 | $88,200 | $173,300 |
| 2019 | $3,342 | $229,200 | $92,200 | $137,000 |
| 2018 | $3,180 | $217,500 | $92,900 | $124,600 |
| 2017 | $3,045 | $217,500 | $92,900 | $124,600 |
| 2016 | $2,960 | $217,200 | $95,700 | $121,500 |
| 2015 | $2,841 | $217,200 | $95,700 | $121,500 |
| 2014 | $2,878 | $228,800 | $95,700 | $133,100 |
Source: Public Records
Map
Nearby Homes
- 65 Bigelow St
- 545 Robeson St
- 45-47 Shawmut St
- 499 Hanover St
- 808 Walnut St
- 49 Farnham St
- 503 Highland Ave
- 862 Locust St
- 610 Walnut St
- 631 Walnut St
- 273 Tremont St
- 884 Cherry St
- 499 Maple St
- 267 Lincoln Ave
- 243 Robeson St Unit 6
- 243 Robeson St Unit 3
- 301 Madison St
- 889 High St
- 909 High St Unit 1
- 528 Cherry St Unit 3
- 638 Robeson St
- 626 Robeson St
- 81 Summerfield St
- 73 Summerfield St
- 73 Summerfield St Unit 2nd Floor
- 59 Summerfield St
- 618 Robeson St
- 639 Robeson St
- 51 Summerfield St
- 633 Robeson St
- 649 Robeson St
- 634 Prospect St
- 623 Robeson St
- 615 Robeson St
- 655 Robeson St
- 644 Prospect St
- 47 Summerfield St
- 616 Prospect St
- 662 Prospect St
- 43 Summerfield St