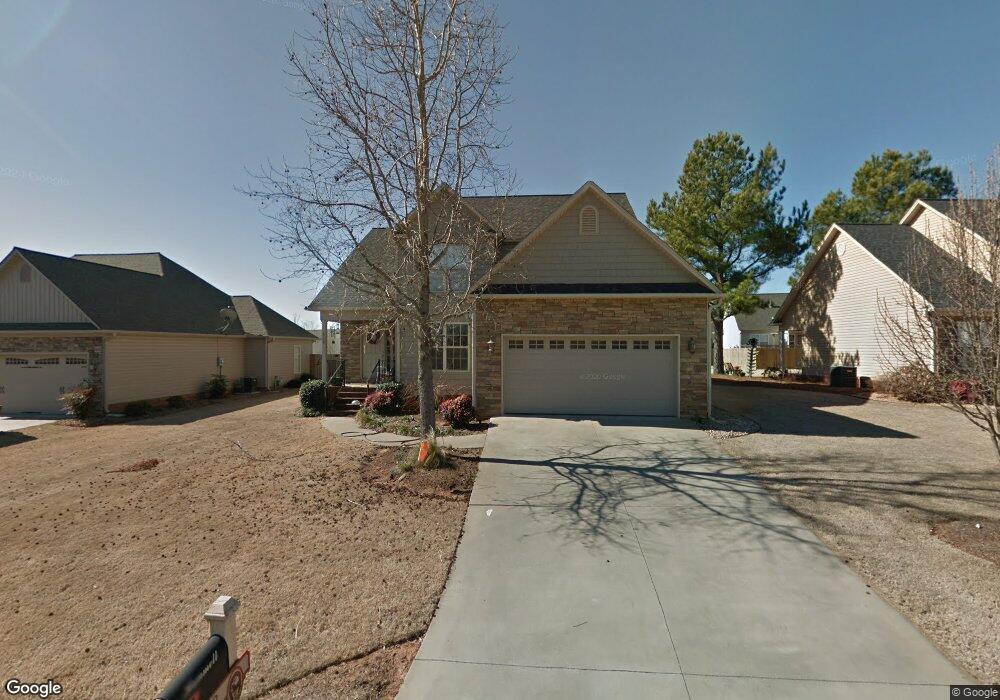
638 Secretariat Dr Boiling Springs, SC 29316
Estimated Value: $287,979 - $328,000
3
Beds
3
Baths
1,886
Sq Ft
$165/Sq Ft
Est. Value
About This Home
This home is located at 638 Secretariat Dr, Boiling Springs, SC 29316 and is currently estimated at $310,495, approximately $164 per square foot. 638 Secretariat Dr is a home located in Spartanburg County with nearby schools including Boiling Springs Middle School, Boiling Springs High School, and High Point Academy.
Ownership History
Date
Name
Owned For
Owner Type
Purchase Details
Closed on
Oct 16, 2020
Sold by
Hammett Landon K and Hammett Elizabeth T
Bought by
Lemaster Greg and Lemaster Sheila
Current Estimated Value
Home Financials for this Owner
Home Financials are based on the most recent Mortgage that was taken out on this home.
Original Mortgage
$159,300
Interest Rate
2.8%
Mortgage Type
New Conventional
Purchase Details
Closed on
Feb 11, 2016
Sold by
Hammett Landon Kyle and Hammett Elizabeth Trussell
Bought by
Lemqasteer Greg and Lemqasteer Sheila
Purchase Details
Closed on
Aug 28, 2006
Sold by
Piedmont Construction Co Inc
Bought by
Hammett Landon K and Hammett Elizabeth T
Home Financials for this Owner
Home Financials are based on the most recent Mortgage that was taken out on this home.
Original Mortgage
$178,900
Interest Rate
6.67%
Mortgage Type
New Conventional
Create a Home Valuation Report for This Property
The Home Valuation Report is an in-depth analysis detailing your home's value as well as a comparison with similar homes in the area
Home Values in the Area
Average Home Value in this Area
Purchase History
| Date | Buyer | Sale Price | Title Company |
|---|---|---|---|
| Lemaster Greg | $169,500 | Amrock Llc | |
| Lemqasteer Greg | $169,077 | None Available | |
| Hammett Landon K | $178,900 | None Available |
Source: Public Records
Mortgage History
| Date | Status | Borrower | Loan Amount |
|---|---|---|---|
| Previous Owner | Lemaster Greg | $159,300 | |
| Previous Owner | Hammett Landon K | $178,900 |
Source: Public Records
Tax History Compared to Growth
Tax History
| Year | Tax Paid | Tax Assessment Tax Assessment Total Assessment is a certain percentage of the fair market value that is determined by local assessors to be the total taxable value of land and additions on the property. | Land | Improvement |
|---|---|---|---|---|
| 2025 | $1,207 | $9,072 | $1,275 | $7,797 |
| 2024 | $1,207 | $9,072 | $1,275 | $7,797 |
| 2023 | $1,207 | $9,072 | $1,275 | $7,797 |
| 2022 | $1,033 | $7,888 | $1,060 | $6,828 |
| 2021 | $1,360 | $7,888 | $1,060 | $6,828 |
| 2020 | $1,337 | $7,857 | $1,056 | $6,801 |
| 2019 | $4,376 | $7,857 | $1,056 | $6,801 |
| 2018 | $1,305 | $7,857 | $1,056 | $6,801 |
| 2017 | $1,147 | $6,832 | $1,060 | $5,772 |
| 2016 | $1,155 | $6,832 | $1,060 | $5,772 |
| 2015 | $1,152 | $6,832 | $1,060 | $5,772 |
| 2014 | $1,137 | $6,832 | $1,060 | $5,772 |
Source: Public Records
Map
Nearby Homes
- 627 Secretariat Dr
- Wisteria II Plan at Lynbrook
- Bradley II Plan at Lynbrook
- Devonshire ll Plan at Lynbrook
- Benton II Plan at Lynbrook
- 3009 Stonemill Trail
- 160 Hunter Ridge Dr
- 152 Hunter Ridge Dr
- 140 Hunter Ridge Dr
- 148 Hunter Ridge Dr
- 151 Hunter Ridge Dr
- 155 Hunter Ridge Dr
- 131 Hunter Ridge Dr
- 143 Hunter Ridge Dr
- 644 Secretariat Dr
- 634 Secretariat Dr
- 927 Thunder Gulch Dr
- 931 Thunder Gulch Dr
- 650 Secretariat Dr
- 628 Secretariat Dr
- 923 Thunder Gulch Dr
- 639 Secretariat Dr
- 935 Thunder Gulch Dr
- 643 Secretariat Dr
- 635 Secretariat Dr
- 919 Thunder Gulch Dr
- 624 Secretariat Dr
- 647 Secretariat Dr
- 654 Secretariat Dr
- 631 Secretariat Dr
- 939 Thunder Gulch Dr
- 928 Thunder Gulch Dr
- 651 Secretariat Dr
- 924 Thunder Gulch Dr