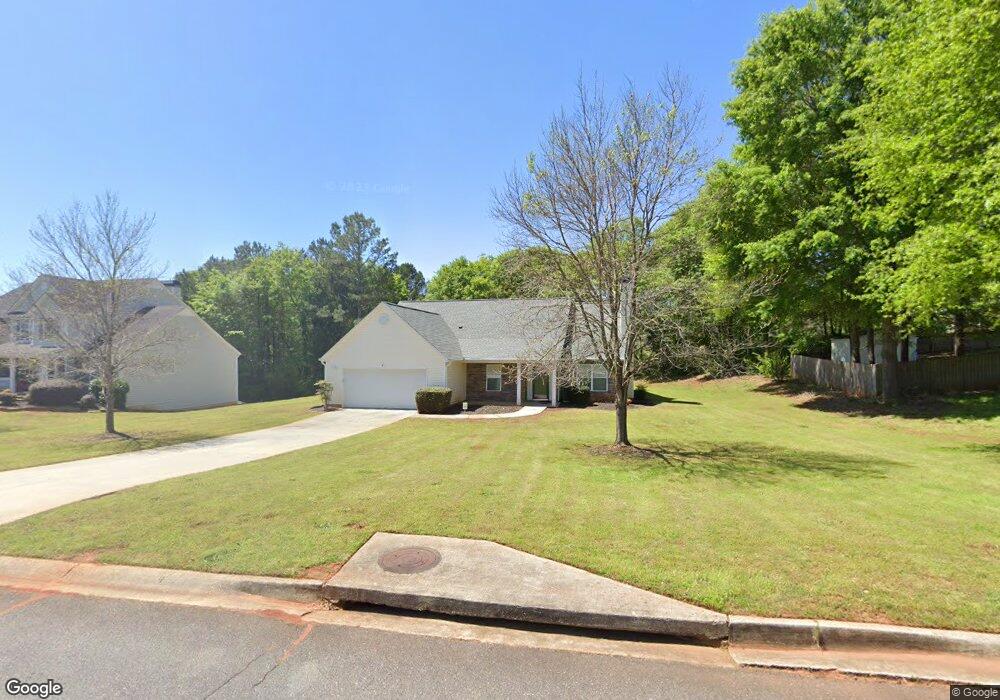
638 Sleeping Meadow Ln Bethlehem, GA 30620
Estimated Value: $329,000 - $346,000
Studio
2
Baths
1,775
Sq Ft
$190/Sq Ft
Est. Value
About This Home
This home is located at 638 Sleeping Meadow Ln, Bethlehem, GA 30620 and is currently estimated at $337,213, approximately $189 per square foot. 638 Sleeping Meadow Ln is a home located in Barrow County with nearby schools including Bethlehem Elementary School, Haymon-Morris Middle School, and Apalachee High School.
Ownership History
Date
Name
Owned For
Owner Type
Purchase Details
Closed on
Jan 28, 2016
Sold by
Branch Marcelle
Bought by
Branch Marcell
Current Estimated Value
Home Financials for this Owner
Home Financials are based on the most recent Mortgage that was taken out on this home.
Original Mortgage
$109,400
Outstanding Balance
$86,772
Interest Rate
4.04%
Mortgage Type
New Conventional
Estimated Equity
$250,441
Purchase Details
Closed on
Apr 21, 2009
Sold by
Branch Marcelle And
Bought by
Branch Marcelle
Purchase Details
Closed on
Oct 25, 2004
Sold by
Meridian Hms Of Ga Inc
Bought by
Branch Marcelle
Home Financials for this Owner
Home Financials are based on the most recent Mortgage that was taken out on this home.
Original Mortgage
$125,900
Interest Rate
6.5%
Mortgage Type
New Conventional
Purchase Details
Closed on
Sep 17, 2003
Sold by
Millstone Development
Bought by
Meridian Homes Of Georgia Inc
Purchase Details
Closed on
Jan 3, 2001
Bought by
Millstone Development
Create a Home Valuation Report for This Property
The Home Valuation Report is an in-depth analysis detailing your home's value as well as a comparison with similar homes in the area
Home Values in the Area
Average Home Value in this Area
Purchase History
| Date | Buyer | Sale Price | Title Company |
|---|---|---|---|
| Branch Marcell | -- | -- | |
| Branch Marcelle | -- | -- | |
| Branch Marcelle | $139,900 | -- | |
| Meridian Homes Of Georgia Inc | $2,409,000 | -- | |
| Millstone Development | -- | -- |
Source: Public Records
Mortgage History
| Date | Status | Borrower | Loan Amount |
|---|---|---|---|
| Open | Branch Marcell | $109,400 | |
| Previous Owner | Branch Marcelle | $125,900 |
Source: Public Records
Tax History
| Year | Tax Paid | Tax Assessment Tax Assessment Total Assessment is a certain percentage of the fair market value that is determined by local assessors to be the total taxable value of land and additions on the property. | Land | Improvement |
|---|---|---|---|---|
| 2025 | $766 | $122,784 | $28,000 | $94,784 |
| 2024 | $1,393 | $120,002 | $28,000 | $92,002 |
| 2023 | $676 | $104,402 | $24,000 | $80,402 |
| 2022 | $713 | $81,404 | $24,000 | $57,404 |
| 2021 | $703 | $73,404 | $16,000 | $57,404 |
| 2020 | $750 | $68,844 | $16,000 | $52,844 |
| 2019 | $2,022 | $68,844 | $16,000 | $52,844 |
| 2018 | $1,822 | $63,084 | $14,800 | $48,284 |
| 2017 | $1,464 | $50,266 | $14,800 | $35,466 |
| 2016 | $1,361 | $48,887 | $14,800 | $34,087 |
| 2015 | $1,379 | $49,261 | $14,800 | $34,461 |
| 2014 | $1,185 | $42,480 | $7,644 | $34,836 |
| 2013 | -- | $40,265 | $7,644 | $32,621 |
Source: Public Records
Map
Nearby Homes
- 308 Meadows Dr
- 286 Meadows Dr
- 253 Meadows Dr
- 1029 Preserve Ln
- 763 Moss Side Dr
- 298 Winslow Way
- 454 Grant Ct
- 1309 Tom Miller Rd
- 1071 Covenant Ct
- 8012 Cypress Point
- 1256 Loganville Hwy
- 934 Beaver Hill Dr
- 1129 Loganville Hwy
- 732 Ridgeland Rd
- 303 Mckendree Ct
- 404 Tanners Bridge Rd
- 627 Bridle Creek Dr
- 209 Angie Way
- 0 Tanners Bridge Cir Unit 10536031
- 476 Tanners Bridge Cir Unit 1
- 636 Sleeping Meadow Ln
- 642 Sleeping Meadow Ln Unit 34
- 642 Sleeping Meadow Ln
- 1406 Ellington Ct
- 1406 Ellington Ct Unit 1
- 1410 Ellington Ct
- 634 Sleeping Meadow Ln
- 1414 Ellington Ct
- 639 Sleeping Meadow Ln
- 632 Sleeping Meadow Ln
- 632 Sleeping Meadow Ln Unit 1
- 637 Sleeping Meadow Ln
- 637 Sleeping Meadow Ln Unit 1
- 641 Sleeping Meadow Ln
- 671 Sleeping Meadow Ln
- 635 Sleeping Meadow Ln
- 643 Sleeping Meadow Ln
- 1416 Ellington Ct
- 630 Sleeping Meadow Ln
- 633 Sleeping Meadow Ln
Your Personal Tour Guide
Ask me questions while you tour the home.