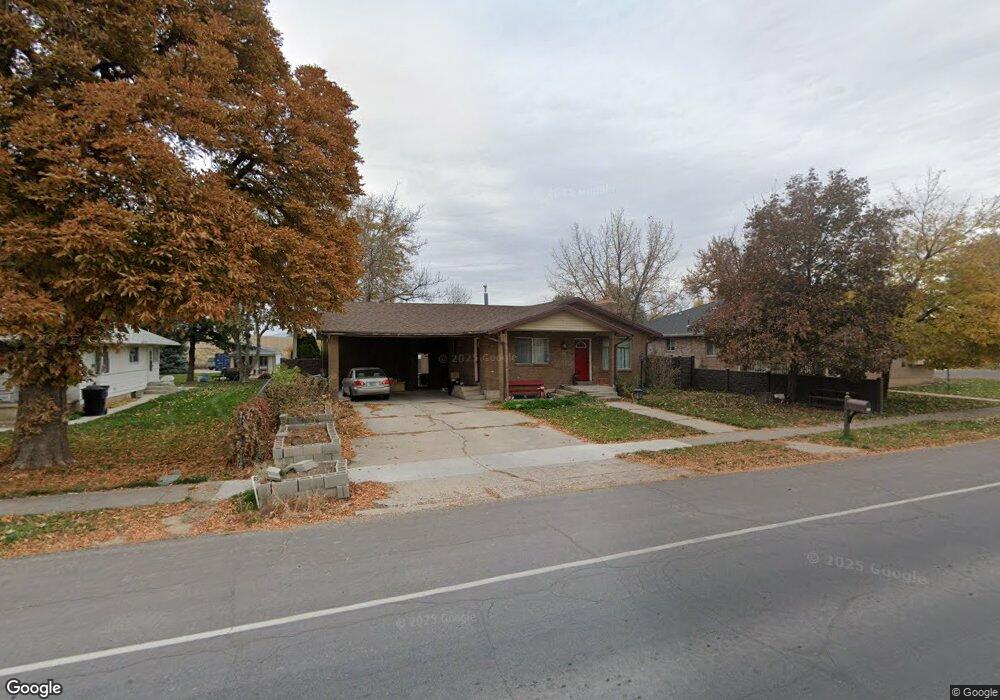
638 W Utah Ave Payson, UT 84651
Estimated Value: $427,699 - $443,000
5
Beds
3
Baths
2,610
Sq Ft
$167/Sq Ft
Est. Value
About This Home
This home is located at 638 W Utah Ave, Payson, UT 84651 and is currently estimated at $436,233, approximately $167 per square foot. 638 W Utah Ave is a home located in Utah County with nearby schools including Taylor Elementary School, Salem Junior High School, and Valley View Middle School.
Ownership History
Date
Name
Owned For
Owner Type
Purchase Details
Closed on
Aug 26, 2014
Sold by
Burke Randall S and Burke Alicia
Bought by
Poulsen Tracy and Poulsen Abraham
Current Estimated Value
Home Financials for this Owner
Home Financials are based on the most recent Mortgage that was taken out on this home.
Original Mortgage
$142,200
Outstanding Balance
$108,743
Interest Rate
4.11%
Mortgage Type
New Conventional
Estimated Equity
$327,490
Purchase Details
Closed on
Apr 8, 1997
Sold by
Rowley Robert D and Rowley Cara
Bought by
Burke Randall S and Burke Alicia
Home Financials for this Owner
Home Financials are based on the most recent Mortgage that was taken out on this home.
Original Mortgage
$98,517
Interest Rate
7.66%
Mortgage Type
FHA
Create a Home Valuation Report for This Property
The Home Valuation Report is an in-depth analysis detailing your home's value as well as a comparison with similar homes in the area
Home Values in the Area
Average Home Value in this Area
Purchase History
| Date | Buyer | Sale Price | Title Company |
|---|---|---|---|
| Poulsen Tracy | -- | Gt Title Services | |
| Burke Randall S | -- | -- |
Source: Public Records
Mortgage History
| Date | Status | Borrower | Loan Amount |
|---|---|---|---|
| Open | Poulsen Tracy | $142,200 | |
| Previous Owner | Burke Randall S | $98,517 |
Source: Public Records
Tax History
| Year | Tax Paid | Tax Assessment Tax Assessment Total Assessment is a certain percentage of the fair market value that is determined by local assessors to be the total taxable value of land and additions on the property. | Land | Improvement |
|---|---|---|---|---|
| 2025 | $2,045 | $224,510 | -- | -- |
| 2024 | $2,045 | $208,120 | $0 | $0 |
| 2023 | $2,042 | $208,395 | $0 | $0 |
| 2022 | $2,155 | $216,260 | $0 | $0 |
| 2021 | $1,841 | $296,400 | $77,900 | $218,500 |
| 2020 | $1,717 | $270,400 | $67,700 | $202,700 |
| 2019 | $1,469 | $237,200 | $60,900 | $176,300 |
| 2018 | $1,316 | $204,800 | $51,500 | $153,300 |
| 2017 | $1,212 | $101,420 | $0 | $0 |
| 2016 | $1,117 | $92,895 | $0 | $0 |
| 2015 | $1,081 | $89,265 | $0 | $0 |
| 2014 | $965 | $80,300 | $0 | $0 |
Source: Public Records
Map
Nearby Homes
- 588 W Utah Ave
- 221 S Majestic Meadows Dr
- 845 W 400 N
- 227 S Majestic Meadows Dr
- 742 W 400 S
- 116 S 300 W
- 128 S 300 W
- 451 N 500 W
- 451 N 500 W Unit 39
- 195 W 300 N
- 533 S 700 W
- 420 N 150 W
- 626 S 800 W Unit 32
- 383 W 625 N Unit A-D
- 384 W 650 N Unit A-D
- 118 E 100 N
- 116 E 100 S
- 361 W 625 N Unit A-D
- 1836 S 100 E
- 9672 S 3550 W
Your Personal Tour Guide
Ask me questions while you tour the home.