Estimated Value: $298,000 - $343,000
3
Beds
2
Baths
1,463
Sq Ft
$217/Sq Ft
Est. Value
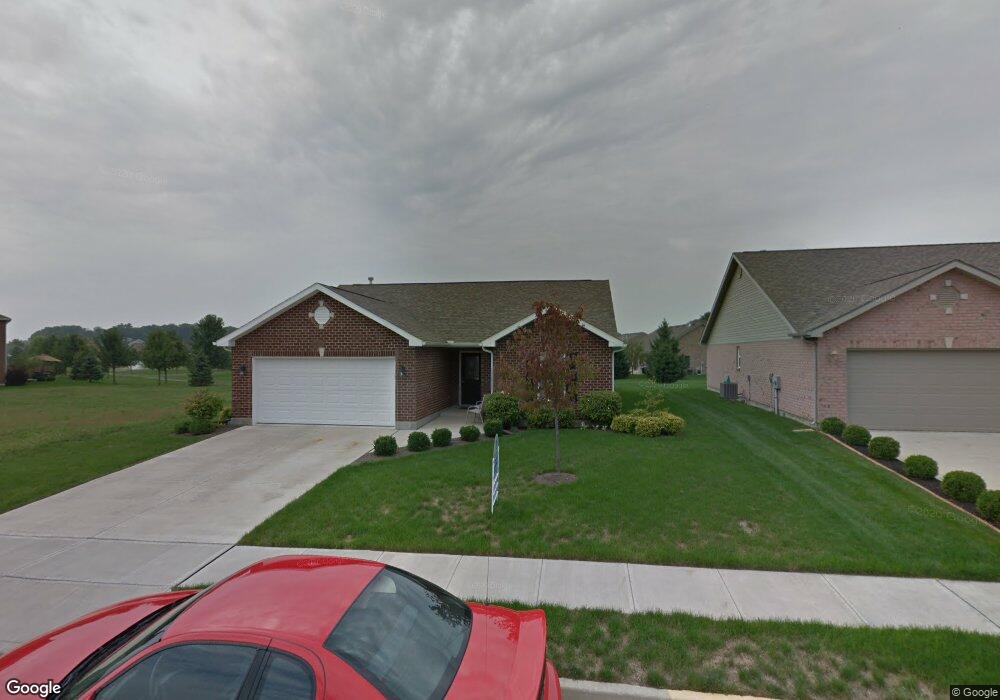
About This Home
This home is located at 638 Willowpoint Ct, Troy, OH 45373 and is currently estimated at $317,821, approximately $217 per square foot. 638 Willowpoint Ct is a home located in Miami County with nearby schools including Concord Elementary School, Troy Junior High School, and Van Cleve Elementary School.
Ownership History
Date
Name
Owned For
Owner Type
Purchase Details
Closed on
Oct 31, 2018
Sold by
White Theron D and White Nancy A
Bought by
Jones Cindy L
Current Estimated Value
Home Financials for this Owner
Home Financials are based on the most recent Mortgage that was taken out on this home.
Original Mortgage
$139,500
Outstanding Balance
$122,158
Interest Rate
4.6%
Mortgage Type
New Conventional
Estimated Equity
$195,663
Purchase Details
Closed on
Jan 12, 2012
Sold by
White Theron D and White Nancy A
Bought by
White Theron D and White Nancy A
Purchase Details
Closed on
Sep 30, 2011
Sold by
Benanzer Thomas G
Bought by
White Theron D and White Nancy A
Purchase Details
Closed on
Sep 29, 2011
Sold by
Benanzer Thomas G
Bought by
White Theron D and White Nancy A
Purchase Details
Closed on
Dec 6, 2006
Sold by
Keystone Homes Of Troy Inc
Bought by
Benanzer Thomas G
Purchase Details
Closed on
Jan 6, 2006
Sold by
Willow Point Properties Inc
Bought by
Keystone Homes Of Troy Inc
Create a Home Valuation Report for This Property
The Home Valuation Report is an in-depth analysis detailing your home's value as well as a comparison with similar homes in the area
Home Values in the Area
Average Home Value in this Area
Purchase History
| Date | Buyer | Sale Price | Title Company |
|---|---|---|---|
| Jones Cindy L | $189,500 | Agility Closing & Title Serv | |
| White Theron D | -- | -- | |
| White Theron D | $144,000 | -- | |
| White Theron D | $144,000 | -- | |
| Benanzer Thomas G | $156,000 | -- | |
| Keystone Homes Of Troy Inc | $35,900 | -- |
Source: Public Records
Mortgage History
| Date | Status | Borrower | Loan Amount |
|---|---|---|---|
| Open | Jones Cindy L | $139,500 | |
| Closed | Keystone Homes Of Troy Inc | $0 |
Source: Public Records
Tax History
| Year | Tax Paid | Tax Assessment Tax Assessment Total Assessment is a certain percentage of the fair market value that is determined by local assessors to be the total taxable value of land and additions on the property. | Land | Improvement |
|---|---|---|---|---|
| 2024 | $3,267 | $74,870 | $17,290 | $57,580 |
| 2023 | $2,824 | $74,870 | $17,290 | $57,580 |
| 2022 | $2,352 | $74,870 | $17,290 | $57,580 |
| 2021 | $1,981 | $59,890 | $13,830 | $46,060 |
| 2020 | $1,984 | $59,890 | $13,830 | $46,060 |
| 2019 | $2,002 | $59,890 | $13,830 | $46,060 |
| 2018 | $1,625 | $55,510 | $14,910 | $40,600 |
| 2017 | $1,641 | $55,510 | $14,910 | $40,600 |
| 2016 | $1,616 | $55,510 | $14,910 | $40,600 |
| 2015 | $1,473 | $49,560 | $13,300 | $36,260 |
| 2014 | $1,473 | $49,560 | $13,300 | $36,260 |
| 2013 | $1,482 | $49,560 | $13,300 | $36,260 |
Source: Public Records
Map
Nearby Homes
- 541 Northpoint Ct
- 2365 Murphy Ln W
- 2290 Murphy Ln E
- 2659 Stonebridge
- 867 Gearhardt Ln
- 673 Sedgwick Way
- 2472 Thornhill Dr
- 3318 Heatherstone Dr
- 606 Barnhart Rd
- 2024 State Route 718
- 536 Barnhart Rd
- 1137 Red Maple Dr
- 612 Barnhart Rd
- 535 Barnhart Rd
- 1112 Red Maple Dr
- 2706 Executive Dr
- 410 Armand Dr
- 1360 Croydon Rd
- 45 Colony Park Dr Unit 4
- 1481 Lantern Ln
- 638 Willow Point Ct
- 630 Willow Point Ct
- 630 Willowpoint Ct
- 644 Willow Point Ct
- 622 Willow Point Ct
- 635 Willow Point Ct
- 635 Willowpoint Ct
- 665 Westlake Dr
- 656 Willowpoint Ct
- 656 Willow Point Ct
- 641 Willowpoint Ct
- 641 Willow Point Ct
- 629 Willowpoint Ct
- 629 Willow Point Ct
- 2455 Lupine Ct
- 649 Willowpoint Ct
- 649 Willow Point Ct
- 2445 Lupine Ct
- 623 Willowpoint Ct
- 618 Willowpoint Ct
Your Personal Tour Guide
Ask me questions while you tour the home.