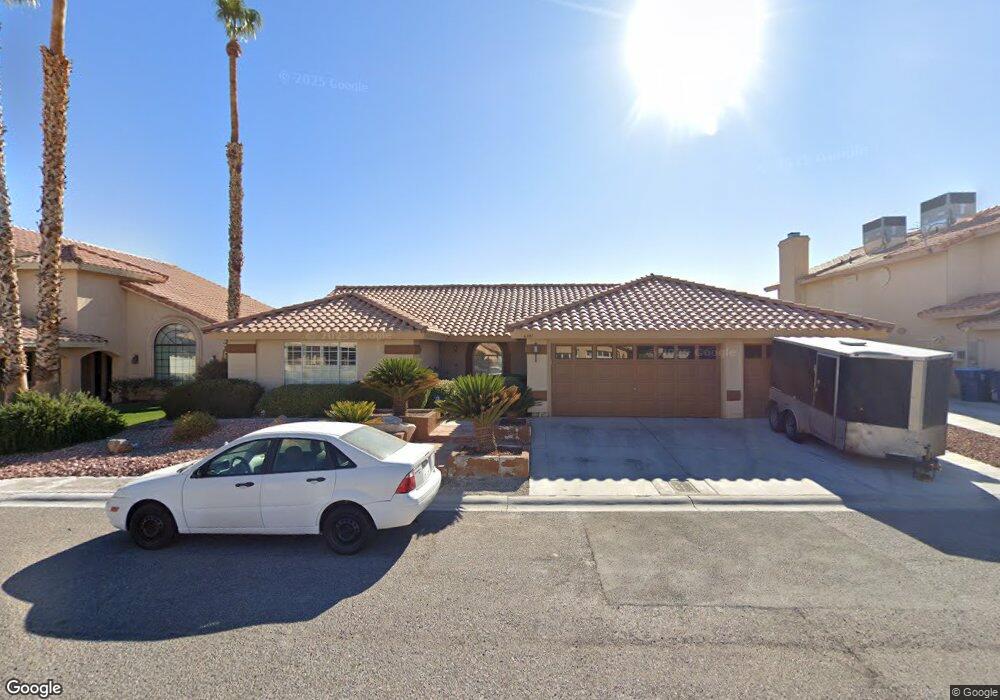
6381 Goody Ct Las Vegas, NV 89118
Estimated Value: $469,796 - $535,000
3
Beds
2
Baths
1,921
Sq Ft
$269/Sq Ft
Est. Value
About This Home
This home is located at 6381 Goody Ct, Las Vegas, NV 89118 and is currently estimated at $516,199, approximately $268 per square foot. 6381 Goody Ct is a home located in Clark County with nearby schools including Marion B Earl Elementary School, Grant Sawyer Middle School, and Durango High School.
Ownership History
Date
Name
Owned For
Owner Type
Purchase Details
Closed on
Oct 10, 2013
Sold by
Jordan Linda M
Bought by
Beesley Jonathan T and Beesley Linda M
Current Estimated Value
Purchase Details
Closed on
Jan 20, 2012
Sold by
Jordan Linda M
Bought by
Jordan Linda M and The Linda M Jordan Revocable Living Trus
Purchase Details
Closed on
Oct 3, 2011
Sold by
Jordan Linda M
Bought by
Jordan Linda M
Purchase Details
Closed on
Jun 22, 2007
Sold by
Jordan Linda M
Bought by
Jordan Linda M and The Linda M Jordan Revocable Living Tr
Purchase Details
Closed on
Jul 16, 2001
Sold by
Brown Forrest G and Brown Marta Golding
Bought by
Jordan Gary L and Jordan Linda M
Home Financials for this Owner
Home Financials are based on the most recent Mortgage that was taken out on this home.
Original Mortgage
$150,000
Outstanding Balance
$57,638
Interest Rate
7.1%
Estimated Equity
$458,561
Create a Home Valuation Report for This Property
The Home Valuation Report is an in-depth analysis detailing your home's value as well as a comparison with similar homes in the area
Home Values in the Area
Average Home Value in this Area
Purchase History
| Date | Buyer | Sale Price | Title Company |
|---|---|---|---|
| Beesley Jonathan T | -- | None Available | |
| Jordan Linda M | -- | None Available | |
| Jordan Linda M | -- | None Available | |
| Jordan Linda M | -- | None Available | |
| Jordan Gary L | $187,500 | Old Republic Title Company |
Source: Public Records
Mortgage History
| Date | Status | Borrower | Loan Amount |
|---|---|---|---|
| Open | Jordan Gary L | $150,000 |
Source: Public Records
Tax History Compared to Growth
Tax History
| Year | Tax Paid | Tax Assessment Tax Assessment Total Assessment is a certain percentage of the fair market value that is determined by local assessors to be the total taxable value of land and additions on the property. | Land | Improvement |
|---|---|---|---|---|
| 2025 | $2,690 | $103,977 | $43,750 | $60,227 |
| 2024 | $2,492 | $103,977 | $43,750 | $60,227 |
| 2023 | $2,492 | $101,822 | $43,750 | $58,072 |
| 2022 | $2,307 | $84,527 | $30,800 | $53,727 |
| 2021 | $2,137 | $80,870 | $29,400 | $51,470 |
| 2020 | $1,981 | $79,424 | $28,000 | $51,424 |
| 2019 | $1,857 | $76,869 | $25,900 | $50,969 |
| 2018 | $1,803 | $73,379 | $23,800 | $49,579 |
| 2017 | $2,174 | $74,133 | $23,450 | $50,683 |
| 2016 | $1,708 | $66,872 | $15,750 | $51,122 |
| 2015 | $1,703 | $62,981 | $12,250 | $50,731 |
| 2014 | $1,654 | $56,303 | $10,500 | $45,803 |
Source: Public Records
Map
Nearby Homes
- 5410 Manteca Cir
- 5195 Sepulveda Blvd
- 5263 Autumn Sky Rd
- 5255 Autumn Sky Rd
- 6358 Elmira Dr
- 6428 Crystal Dew Dr
- 5201 S Torrey Pines Dr Unit 1227
- 5201 S Torrey Pines Dr Unit 1253
- 5535 Mount Diablo Dr
- 5263 Shasta Lake Way
- 5212 Shasta Lake Way
- 5595 El Camino Rd
- 5568 Yellow Ash St
- 6078 Sunken River Trail
- 5236 Ladyhawk Way
- 5603 Deer Creek Falls Ct
- 5170 S Jones Blvd Unit 108
- 5633 Steampunk St
- 6012 Prospector Trail
- 5638 Wild Olive St