6381 W Berrien St Eau Claire, MI 49111
Estimated Value: $127,859 - $191,000
2
Beds
1
Bath
1,090
Sq Ft
$143/Sq Ft
Est. Value
About This Home
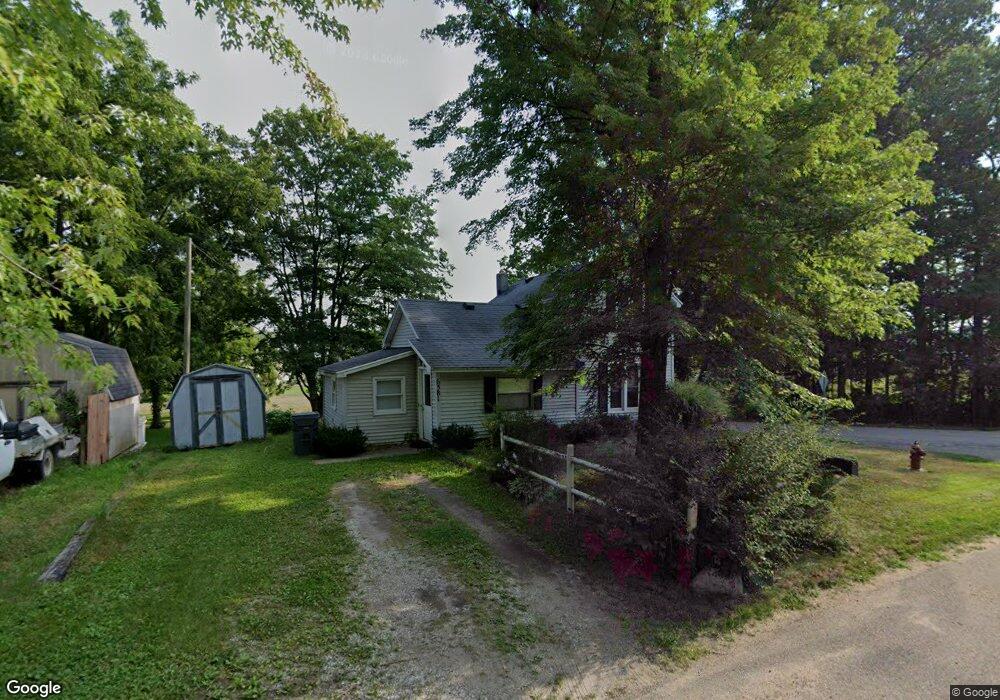
This home is located at 6381 W Berrien St, Eau Claire, MI 49111 and is currently estimated at $156,215, approximately $143 per square foot. 6381 W Berrien St is a home located in Berrien County with nearby schools including Lybrook Elementary School, Eau Claire Middle School, and Eau Claire High School.
Ownership History
Date
Name
Owned For
Owner Type
Purchase Details
Closed on
Aug 7, 2009
Sold by
Jenck Llc
Bought by
Hurst Carolyn M
Current Estimated Value
Home Financials for this Owner
Home Financials are based on the most recent Mortgage that was taken out on this home.
Original Mortgage
$64,260
Outstanding Balance
$42,069
Interest Rate
5.29%
Mortgage Type
Purchase Money Mortgage
Estimated Equity
$114,146
Purchase Details
Closed on
Dec 23, 2008
Sold by
U S Bank National Association
Bought by
Jerick Llc
Purchase Details
Closed on
Dec 27, 2007
Sold by
Brewer Jennifer
Bought by
U S Bank Na
Purchase Details
Closed on
Jun 3, 2005
Sold by
Nelson Victoria L
Bought by
Brewer Jennifer
Home Financials for this Owner
Home Financials are based on the most recent Mortgage that was taken out on this home.
Original Mortgage
$78,000
Interest Rate
5.91%
Mortgage Type
Fannie Mae Freddie Mac
Purchase Details
Closed on
Apr 19, 1994
Purchase Details
Closed on
Oct 13, 1993
Purchase Details
Closed on
Mar 14, 1979
Create a Home Valuation Report for This Property
The Home Valuation Report is an in-depth analysis detailing your home's value as well as a comparison with similar homes in the area
Home Values in the Area
Average Home Value in this Area
Purchase History
| Date | Buyer | Sale Price | Title Company |
|---|---|---|---|
| Hurst Carolyn M | $63,000 | Chicago Title | |
| Jerick Llc | $24,000 | Attorneys Title Agency Llc | |
| U S Bank Na | $38,500 | None Available | |
| Brewer Jennifer | $78,000 | -- | |
| -- | $27,000 | -- | |
| -- | -- | -- | |
| -- | $6,400 | -- | |
| -- | $100 | -- |
Source: Public Records
Mortgage History
| Date | Status | Borrower | Loan Amount |
|---|---|---|---|
| Open | Hurst Carolyn M | $64,260 | |
| Previous Owner | Brewer Jennifer | $78,000 |
Source: Public Records
Tax History Compared to Growth
Tax History
| Year | Tax Paid | Tax Assessment Tax Assessment Total Assessment is a certain percentage of the fair market value that is determined by local assessors to be the total taxable value of land and additions on the property. | Land | Improvement |
|---|---|---|---|---|
| 2025 | $1,217 | $51,600 | $0 | $0 |
| 2024 | $995 | $42,700 | $0 | $0 |
| 2023 | $948 | $40,000 | $0 | $0 |
| 2022 | $903 | $33,800 | $0 | $0 |
| 2021 | $1,535 | $31,400 | $6,100 | $25,300 |
| 2020 | $1,510 | $30,400 | $0 | $0 |
| 2019 | $1,486 | $26,100 | $5,600 | $20,500 |
| 2018 | $2,134 | $26,100 | $0 | $0 |
| 2017 | $1,479 | $26,800 | $0 | $0 |
| 2016 | $1,514 | $27,800 | $0 | $0 |
| 2015 | $1,556 | $29,500 | $0 | $0 |
| 2014 | $422 | $28,300 | $0 | $0 |
Source: Public Records
Map
Nearby Homes
- 33240 School St
- V/L Hipps Hollow Rd
- 6585 Sommer Rd
- 4754 Kimber Ln
- 8974 Michigan 140
- 5027 E Bluffview Dr
- 5835 Windy Acres Ln
- 8687 Lilac Ln
- 601 Ann Dr
- 315 E Washington St
- 535 N Bluff St
- 8892 Maplewood Dr
- 604 N Mechanic St
- 4511 Oxbow Rd
- 5728 Orchard Dr
- 312 N Cass St
- 628 Saint Joseph Ave
- 402 S Main St
- 312 W Madison St
- 201 S Harrison St
- 6373 W Berrien St
- 6369 W Berrien St
- 7347 Sanders St
- 7374 Taylor St
- 6360 W Berrien St
- 6364 W Main St
- 6372 W Berrien St
- 7344 Sanders St
- 6348 W Berrien St
- 6405 W Main St
- 7398 Taylor St
- 6345 W Berrien St
- 6350 W Main St
- 7401 Taylor St
- 6349 Porter Dr
- 6335 W Berrien St
- 6342 W Berrien St
- 6361 Porter Dr
- 6333 Porter Dr
- 7240 1st St