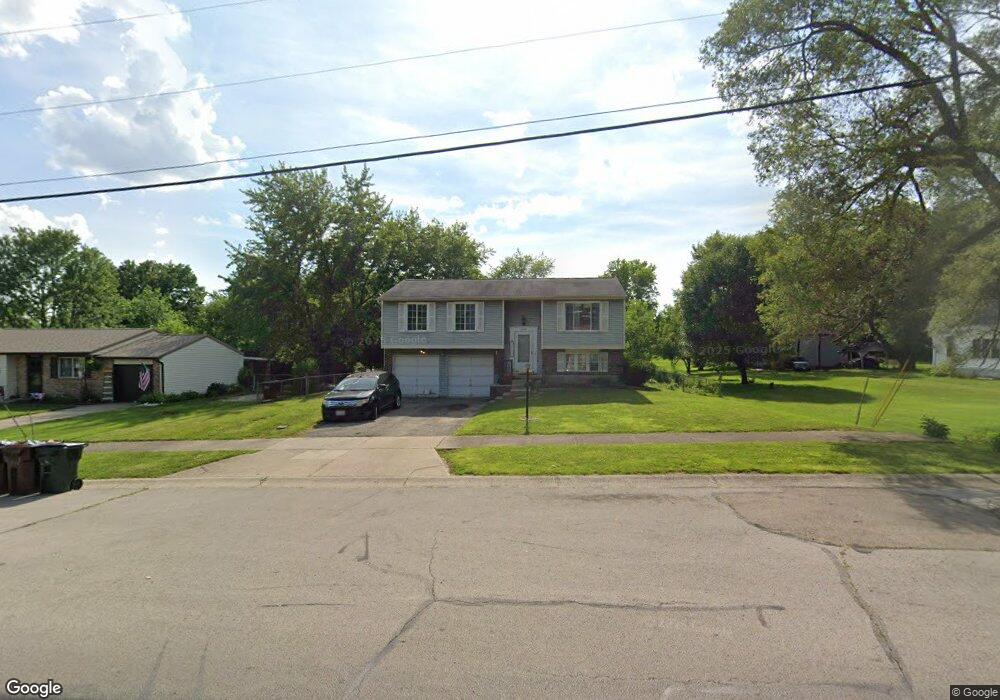
6385 Union Rd Clayton, OH 45315
Estimated Value: $181,000 - $229,000
3
Beds
2
Baths
1,028
Sq Ft
$196/Sq Ft
Est. Value
About This Home
This home is located at 6385 Union Rd, Clayton, OH 45315 and is currently estimated at $201,743, approximately $196 per square foot. 6385 Union Rd is a home located in Montgomery County with nearby schools including Northmoor Elementary School, Northmont High School, and Trotwood Preparatory & Fitness Academy.
Ownership History
Date
Name
Owned For
Owner Type
Purchase Details
Closed on
Oct 28, 2017
Sold by
Melin Scott A and Melin Nicole L
Bought by
Melin Scott A and Melin Nicole L
Current Estimated Value
Purchase Details
Closed on
Apr 27, 2006
Sold by
Melin Scott A and Melin Scott
Bought by
Melin Scott A and Melin Nicole L
Home Financials for this Owner
Home Financials are based on the most recent Mortgage that was taken out on this home.
Original Mortgage
$100,000
Outstanding Balance
$56,606
Interest Rate
6.39%
Mortgage Type
Purchase Money Mortgage
Estimated Equity
$145,137
Purchase Details
Closed on
Mar 6, 2006
Sold by
Chase Manhattan Bank Na
Bought by
Melin Scott
Home Financials for this Owner
Home Financials are based on the most recent Mortgage that was taken out on this home.
Original Mortgage
$100,000
Outstanding Balance
$56,606
Interest Rate
6.39%
Mortgage Type
Purchase Money Mortgage
Estimated Equity
$145,137
Purchase Details
Closed on
Sep 30, 2005
Sold by
Koerner Ronald E
Bought by
Chase Manhattan Bank Na
Create a Home Valuation Report for This Property
The Home Valuation Report is an in-depth analysis detailing your home's value as well as a comparison with similar homes in the area
Home Values in the Area
Average Home Value in this Area
Purchase History
| Date | Buyer | Sale Price | Title Company |
|---|---|---|---|
| Melin Scott A | -- | None Available | |
| Melin Scott A | -- | None Available | |
| Melin Scott | $87,500 | Resource Title Agency Inc | |
| Chase Manhattan Bank Na | $95,000 | Resource Title Agency Inc |
Source: Public Records
Mortgage History
| Date | Status | Borrower | Loan Amount |
|---|---|---|---|
| Open | Melin Scott A | $100,000 |
Source: Public Records
Tax History
| Year | Tax Paid | Tax Assessment Tax Assessment Total Assessment is a certain percentage of the fair market value that is determined by local assessors to be the total taxable value of land and additions on the property. | Land | Improvement |
|---|---|---|---|---|
| 2025 | $3,364 | $55,050 | $14,830 | $40,220 |
| 2024 | $3,544 | $55,050 | $14,830 | $40,220 |
| 2023 | $3,544 | $55,050 | $14,830 | $40,220 |
| 2022 | $2,618 | $33,780 | $9,100 | $24,680 |
| 2021 | $2,908 | $33,780 | $9,100 | $24,680 |
| 2020 | $2,624 | $33,780 | $9,100 | $24,680 |
| 2019 | $2,415 | $27,990 | $9,100 | $18,890 |
| 2018 | $2,422 | $27,990 | $9,100 | $18,890 |
| 2017 | $2,634 | $27,990 | $9,100 | $18,890 |
| 2016 | $2,651 | $27,610 | $9,100 | $18,510 |
| 2015 | $2,572 | $27,610 | $9,100 | $18,510 |
| 2014 | $2,572 | $27,610 | $9,100 | $18,510 |
| 2012 | -- | $35,290 | $9,100 | $26,190 |
Source: Public Records
Map
Nearby Homes
- 5025 Willow Rd
- 6269 Fall Gold Dr
- Ashton Plan at Hunters Path
- Cooper Plan at Hunters Path
- Norway Plan at Hunters Path
- Juniper Plan at Hunters Path
- 1003 Redwood Rd
- Chestnut Plan at Hunters Path
- Palmetto Plan at Hunters Path
- Ironwood Plan at Hunters Path
- Spruce Plan at Hunters Path
- Aspen II Plan at Hunters Path
- Empress Plan at Hunters Path
- Bradford Plan at Hunters Path
- Walnut Plan at Hunters Path
- 1018 Redwood Rd
- 6583 Benjamin Franklin Dr
- 4002 Summit Ct
- 2027 Ivy Rd
- 6042 Cinnamon Tree Ct
- 6375 Union Rd
- 6397 Union Rd
- 6340 Silverbell Ct
- 6350 Silverbell Ct
- 6357 Union Rd
- 6382 Union Rd
- 6330 Silverbell Ct
- 6425 Union Rd
- 6339 Union Rd
- 6416 Union Rd
- 6320 Silverbell Ct
- 6350 Union Rd
- 6351 Silverbell Ct
- 6319 N Union Rd
- 6319 Union Rd
- 6331 Silverbell Ct
- 6341 Silverbell Ct
- 6310 Silverbell Ct
- 6321 Silverbell Ct
- 6436 Union Rd
Your Personal Tour Guide
Ask me questions while you tour the home.