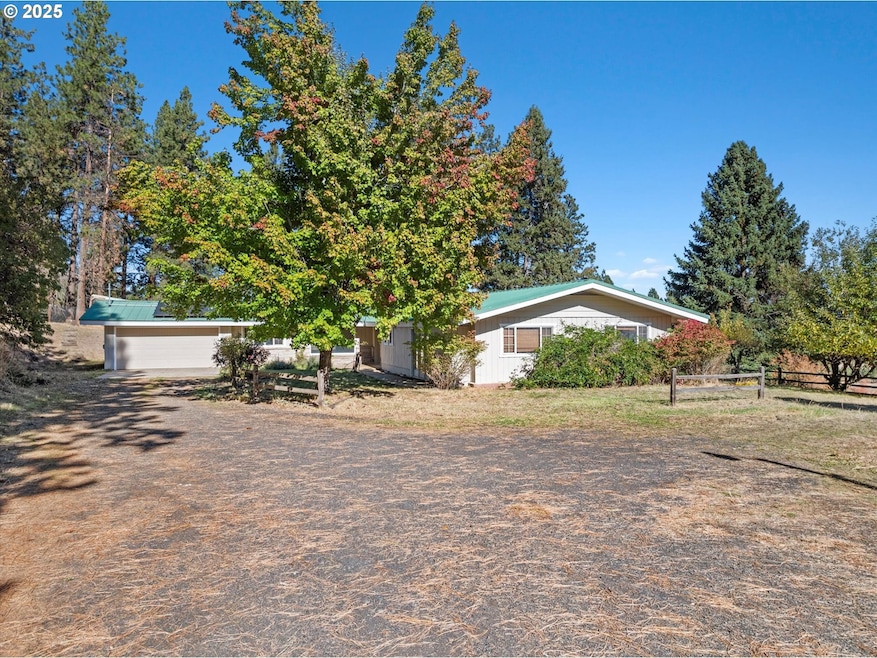
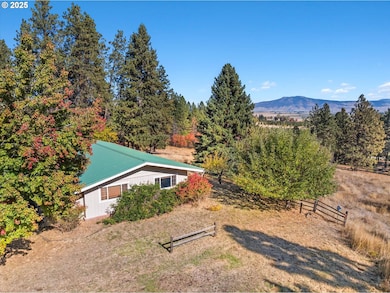
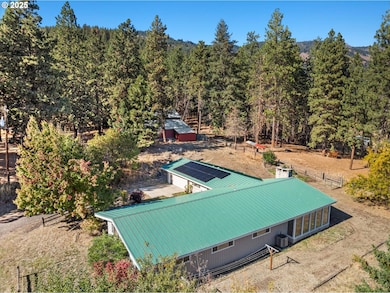
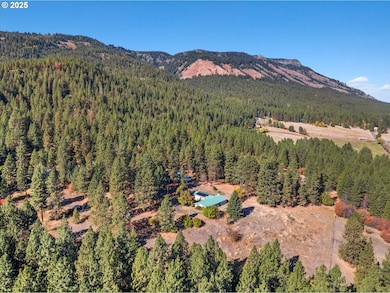
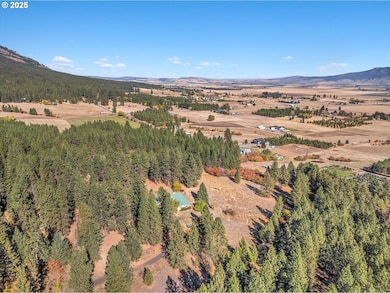
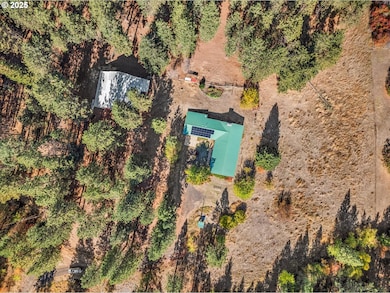
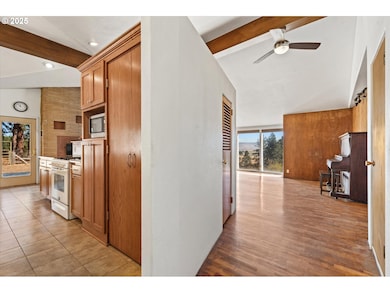
NOT LISTED FOR SALE

63881 Lester Rd La Grande, OR 97850

Estimated Value: $686,190 - $731,000

4 Beds
3 Baths
2,689 Sq Ft
$264/Sq Ft Est. Value

About This Home

This home is located at 63881 Lester Rd, La Grande, OR 97850 and is currently estimated at $708,595, approximately $263 per square foot. 63881 Lester Rd is a home located in Union County with nearby schools including La Grande High School.

Ownership History

Date Name Owned For Owner Type

Purchase Details

Closed on
May 29, 2014
Sold by
Walker Bernard S and Walker Kristin L
Bought by
Bronstein Seymour Maynard
Current Estimated Value
$708,595

Home Financials for this Owner

Home Financials are based on the most recent Mortgage that was taken out on this home.
Original Mortgage
$328,800
Outstanding Balance
$257,018
Interest Rate
4.25%
Mortgage Type
New Conventional
Estimated Equity
$490,213

Purchase Details

Closed on
Dec 12, 2006
Sold by
Bonavia Anthony G
Bought by
Walker Bernard S and Walker Kristin L

Home Financials for this Owner

Home Financials are based on the most recent Mortgage that was taken out on this home.
Original Mortgage
$280,000
Interest Rate
6%
Mortgage Type
Adjustable Rate Mortgage/ARM

Range of Values:

Collateral Analytics

Collateral Analytics Collateral Analytics AVMs (Automated Valuation Model) employ a number of statistical approaches combined with neighborhood-specific comparable selection guarantees the most up-to-date and precise valuations.

Not Available

Collateral Analytics does not have data for the current month. Please view the chart for historical values.

ICE

ICE Mortgage Technology ICE Mortgage Technology’s AVM (Automated Valuation Model) is a state-of-the-art online residential property valuation tool that provides a quick and accurate estimate of the value of almost any home in the U.S.

Not Available

ICE Mortgage Technology does not have data for the current month. Please view the chart for historical values.

First American

First American First American Data & Analytics’ next-generation AVM combines unrivaled data assets with a blended ensemble of valuation models to produce highly accurate, reliable valuations you can trust.

Not Available

First American does not have data for the current month. Please view the chart for historical values.

Quantarium

Quantarium Quantarium’s valuation service, repeatedly proven the industry’s most accurate and comprehensive, is supercharged with a self-learning and auto-tuning AI engine that continually becomes smarter and more accurate as it processes daily inputs from the industry’s leading RE data lake.

Not Available

Quantarium does not have data for the current month. Please view the chart for historical values.

Average Value
Not Available
List Price
Sold Price
Create a Home Valuation Report for This Property
The Home Valuation Report is an in-depth analysis detailing your home's value as well as a comparison with similar homes in the area

Home Values in the Area

Source: Public Records

Average Home Value in this Area


Source: Public Records

Purchase History

Date Buyer Sale Price Title Company
Bronstein Seymour Maynard $415,000 Eastern Oregon Title Inc
Walker Bernard S $350,000 Eastern Oregon Title Inc
Source: Public Records

Mortgage History

Date Status Borrower Loan Amount
Open Bronstein Seymour Maynard $81,000
Open Bronstein Seymour Maynard $328,800
Previous Owner Walker Bernard S $273,500
Previous Owner Walker Bernard S $285,500
Previous Owner Walker Bernard S $283,000
Previous Owner Walker Bernard S $280,000
Source: Public Records

Tax History Compared to Growth

Source: Public Records

Tax History

Year Tax Paid Tax Assessment Tax Assessment Total Assessment is a certain percentage of the fair market value that is determined by local assessors to be the total taxable value of land and additions on the property. Land Improvement
2024 $3,420 $297,420 $21,800 $275,620
2023 $3,450 $288,770 $21,170 $267,600
2022 $3,100 $280,371 $20,556 $259,815
2021 $3,032 $272,206 $19,958 $252,248
2020 $2,890 $264,278 $19,376 $244,902
2019 $2,813 $256,581 $18,812 $237,769
2018 $2,778 $249,108 $18,265 $230,843
2017 $2,802 $241,853 $17,734 $224,119
2016 $2,570 $234,809 $17,218 $217,591
2015 $2,023 $227,971 $16,717 $211,254
2014 $2,023 $221,331 $16,230 $205,101
2013 $1,966 $214,885 $15,758 $199,127
Source: Public Records

Map