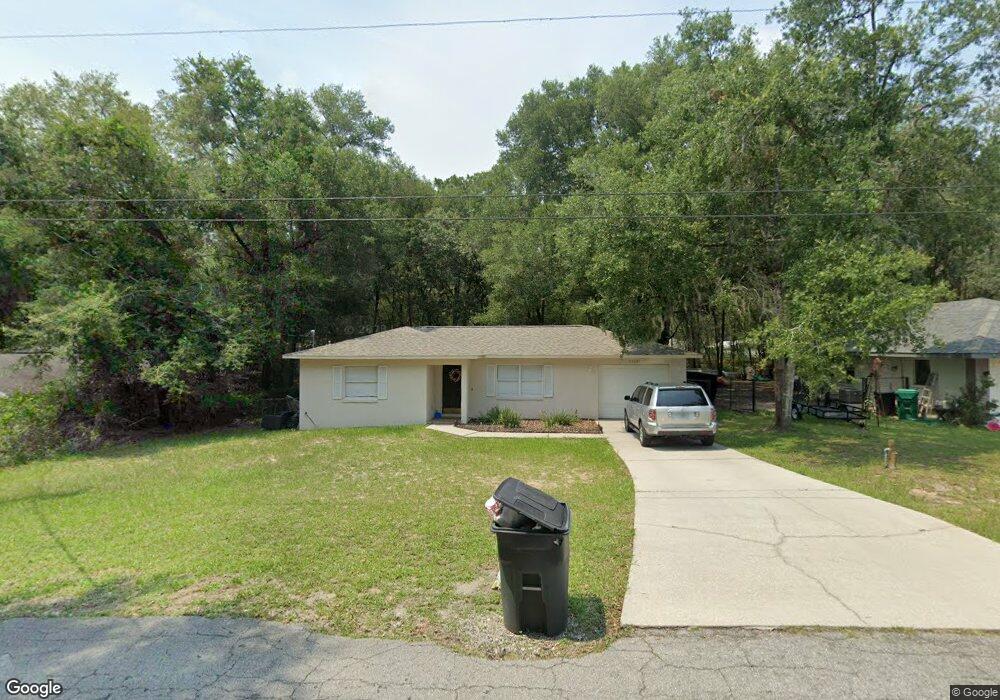
6389 E Mobile St Inverness, FL 34452
Estimated Value: $188,267 - $262,000
3
Beds
2
Baths
931
Sq Ft
$229/Sq Ft
Est. Value
About This Home
This home is located at 6389 E Mobile St, Inverness, FL 34452 and is currently estimated at $213,567, approximately $229 per square foot. 6389 E Mobile St is a home located in Citrus County with nearby schools including Pleasant Grove Elementary School, Inverness Middle School, and Citrus High School.
Ownership History
Date
Name
Owned For
Owner Type
Purchase Details
Closed on
Nov 21, 2012
Sold by
Gerkensmeyer Linda J
Bought by
Crook Barbara L and Crook Russell P
Current Estimated Value
Purchase Details
Closed on
Nov 1, 2008
Sold by
The Crook Trust
Bought by
Gerkensmeyer Linda J
Home Financials for this Owner
Home Financials are based on the most recent Mortgage that was taken out on this home.
Original Mortgage
$115,000
Interest Rate
6.5%
Mortgage Type
Seller Take Back
Purchase Details
Closed on
Jun 1, 2000
Sold by
Smith Andrea Nichole Griffin
Bought by
Crook Russell P and Crook Barbara L
Purchase Details
Closed on
Dec 1, 1997
Bought by
Crook Barbara L and Crook Russell P
Purchase Details
Closed on
May 1, 1996
Bought by
Crook Barbara L and Crook Russell P
Purchase Details
Closed on
Sep 1, 1995
Bought by
Crook Barbara L and Crook Russell P
Purchase Details
Closed on
Oct 1, 1981
Bought by
Crook Barbara L and Crook Russell P
Create a Home Valuation Report for This Property
The Home Valuation Report is an in-depth analysis detailing your home's value as well as a comparison with similar homes in the area
Home Values in the Area
Average Home Value in this Area
Purchase History
| Date | Buyer | Sale Price | Title Company |
|---|---|---|---|
| Crook Barbara L | -- | None Available | |
| Gerkensmeyer Linda J | $115,000 | None Available | |
| Crook Russell P | -- | -- | |
| Crook Barbara L | $100 | -- | |
| Crook Barbara L | $52,600 | -- | |
| Crook Barbara L | $2,000 | -- | |
| Crook Barbara L | $1,000 | -- |
Source: Public Records
Mortgage History
| Date | Status | Borrower | Loan Amount |
|---|---|---|---|
| Previous Owner | Gerkensmeyer Linda J | $115,000 |
Source: Public Records
Tax History Compared to Growth
Tax History
| Year | Tax Paid | Tax Assessment Tax Assessment Total Assessment is a certain percentage of the fair market value that is determined by local assessors to be the total taxable value of land and additions on the property. | Land | Improvement |
|---|---|---|---|---|
| 2024 | $1,881 | $142,005 | $6,240 | $135,765 |
| 2023 | $1,881 | $99,816 | $0 | $0 |
| 2022 | $1,593 | $112,322 | $4,000 | $108,322 |
| 2021 | $1,383 | $89,657 | $3,520 | $86,137 |
| 2020 | $1,235 | $82,003 | $3,320 | $78,683 |
| 2019 | $1,143 | $73,724 | $3,050 | $70,674 |
| 2018 | $1,040 | $66,058 | $3,480 | $62,578 |
| 2017 | $948 | $56,344 | $2,840 | $53,504 |
| 2016 | $928 | $54,130 | $2,860 | $51,270 |
| 2015 | $853 | $47,370 | $2,180 | $45,190 |
| 2014 | $858 | $46,030 | $4,030 | $42,000 |
Source: Public Records
Map
Nearby Homes
- 4229 S Culver Terrace
- 6325 E Kent St
- 4349 S Culver Terrace
- 6490 E Lynn St
- 4229 S Canton Terrace
- 6188 E Oneida St
- 6000 E Oneida St
- 6370 E Oneida St
- 6162 E Malverne St
- 6101 E Menlo Ln
- 6162 E Oneida St
- 6046 E King Ln
- 6066 E King Ln
- 6093 E Malverne St
- 6233 E Joyce Ln
- 4001 S Linwood Terrace
- 3956 S Fernpark Terrace
- 6046 E Loring Ln
- 6690 E Lowden St
- 3988 S Highlands Ave
- 6401 E Mobile St
- 6375 E Mobile St
- 6415 E Mobile St
- 6400 E Mobile St
- 6414 Lowden St
- 6414 E Mobile St
- 6431 E Mobile St
- 6389 E Lowden St
- 6391 E Morley St
- 6401 E Lowden St
- 6375 E Lowden St
- 6373 E Morley St
- 6415 E Lowden St
- 6361 E Lowden St
- 6444 E Mobile St
- 6343 E Lowden St
- 6324 E Mobile St
- 6431 E Lowden St
- 6343 E Morley St
- 6461 E Mobile St