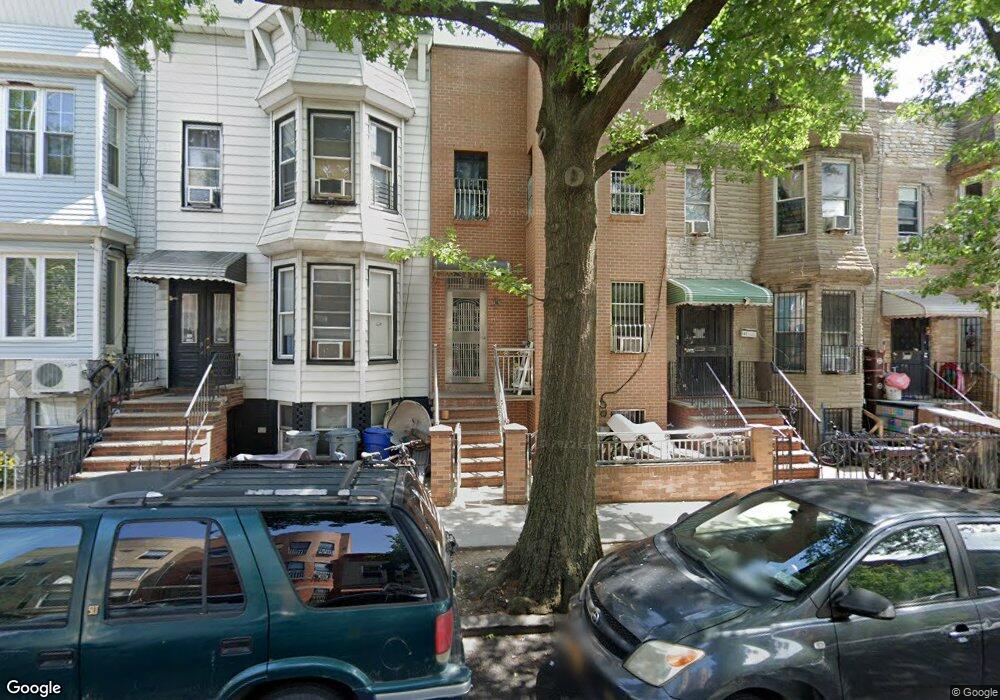
639 49th St Brooklyn, NY 11220
Sunset Park NeighborhoodEstimated Value: $1,531,000 - $1,715,000
Studio
--
Bath
2,232
Sq Ft
$724/Sq Ft
Est. Value
About This Home
This home is located at 639 49th St, Brooklyn, NY 11220 and is currently estimated at $1,616,242, approximately $724 per square foot. 639 49th St is a home located in Kings County with nearby schools including P.S. 94 The Henry Longfellow School, IS 220 John J. Pershing, and Leep Dual Language Academy Charter School.
Ownership History
Date
Name
Owned For
Owner Type
Purchase Details
Closed on
Aug 1, 2014
Sold by
Pizzuti Peter
Bought by
Lin Mei Zhen
Current Estimated Value
Home Financials for this Owner
Home Financials are based on the most recent Mortgage that was taken out on this home.
Original Mortgage
$533,850
Outstanding Balance
$406,755
Interest Rate
4.09%
Mortgage Type
New Conventional
Estimated Equity
$1,209,487
Purchase Details
Closed on
Jan 24, 2007
Sold by
Pizzuti Nancy
Bought by
Pizzuti Peter
Create a Home Valuation Report for This Property
The Home Valuation Report is an in-depth analysis detailing your home's value as well as a comparison with similar homes in the area
Home Values in the Area
Average Home Value in this Area
Purchase History
| Date | Buyer | Sale Price | Title Company |
|---|---|---|---|
| Lin Mei Zhen | $850,000 | -- | |
| Pizzuti Peter | -- | -- |
Source: Public Records
Mortgage History
| Date | Status | Borrower | Loan Amount |
|---|---|---|---|
| Open | Lin Mei Zhen | $533,850 |
Source: Public Records
Tax History
| Year | Tax Paid | Tax Assessment Tax Assessment Total Assessment is a certain percentage of the fair market value that is determined by local assessors to be the total taxable value of land and additions on the property. | Land | Improvement |
|---|---|---|---|---|
| 2025 | $9,812 | $99,840 | $22,920 | $76,920 |
| 2024 | $9,812 | $93,300 | $22,920 | $70,380 |
| 2023 | $9,789 | $101,700 | $22,920 | $78,780 |
| 2022 | $9,078 | $102,360 | $22,920 | $79,440 |
| 2021 | $9,215 | $90,840 | $22,920 | $67,920 |
| 2020 | $4,415 | $87,000 | $22,920 | $64,080 |
| 2019 | $8,516 | $69,180 | $22,920 | $46,260 |
| 2018 | $8,298 | $40,708 | $14,047 | $26,661 |
| 2017 | $5,070 | $24,871 | $8,951 | $15,920 |
| 2016 | $4,691 | $23,467 | $8,931 | $14,536 |
| 2015 | $2,353 | $22,144 | $11,756 | $10,388 |
| 2014 | $2,353 | $20,901 | $13,307 | $7,594 |
Source: Public Records
Map
Nearby Homes