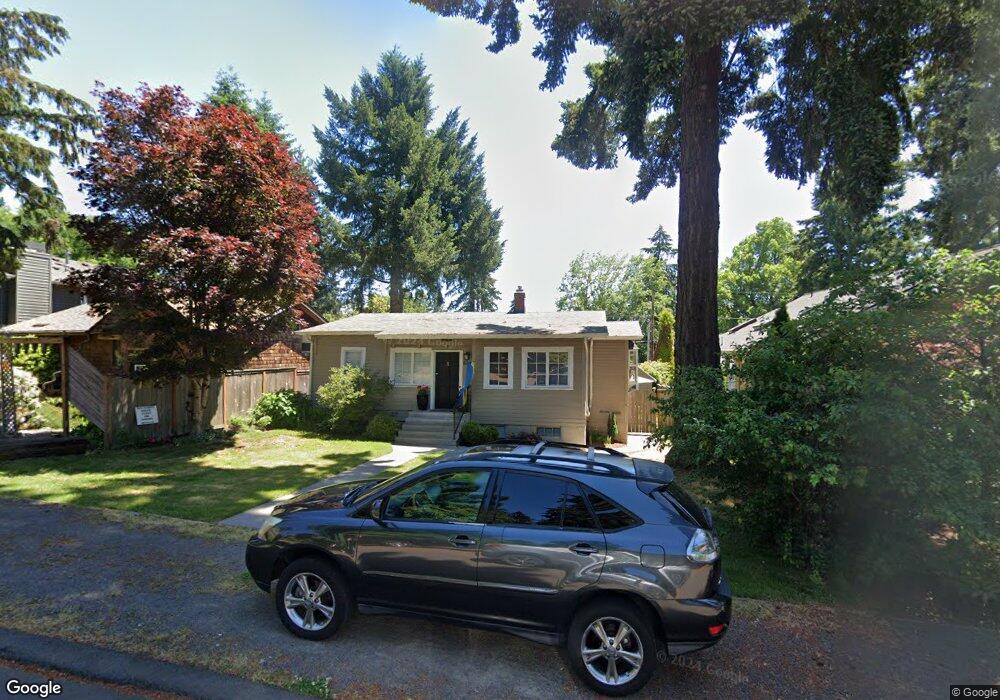
639 7th St Lake Oswego, OR 97034
Evergreen NeighborhoodEstimated Value: $919,000 - $970,000
3
Beds
1
Bath
1,066
Sq Ft
$881/Sq Ft
Est. Value
About This Home
This home is located at 639 7th St, Lake Oswego, OR 97034 and is currently estimated at $939,504, approximately $881 per square foot. 639 7th St is a home located in Clackamas County with nearby schools including Forest Hills Elementary School, Lake Oswego Junior High School, and Lake Oswego Senior High School.
Ownership History
Date
Name
Owned For
Owner Type
Purchase Details
Closed on
Mar 4, 2013
Sold by
Stayer Mark A and Stayer Candice W
Bought by
Marcan Properties 639 Llc
Current Estimated Value
Purchase Details
Closed on
May 28, 2001
Sold by
Rosebrugh Christopher P
Bought by
Stayer Mark A and Stayer Candice W
Home Financials for this Owner
Home Financials are based on the most recent Mortgage that was taken out on this home.
Original Mortgage
$170,000
Interest Rate
7.15%
Purchase Details
Closed on
Sep 23, 1997
Sold by
Eiswerth Kristy
Bought by
Rosebrugh Christopher P
Home Financials for this Owner
Home Financials are based on the most recent Mortgage that was taken out on this home.
Original Mortgage
$143,600
Interest Rate
6.75%
Create a Home Valuation Report for This Property
The Home Valuation Report is an in-depth analysis detailing your home's value as well as a comparison with similar homes in the area
Home Values in the Area
Average Home Value in this Area
Purchase History
| Date | Buyer | Sale Price | Title Company |
|---|---|---|---|
| Marcan Properties 639 Llc | $242,000 | Chicago Title | |
| Stayer Mark A | $242,000 | Ticor Title | |
| Rosebrugh Christopher P | $179,500 | Chicago Title Insurance Co |
Source: Public Records
Mortgage History
| Date | Status | Borrower | Loan Amount |
|---|---|---|---|
| Previous Owner | Stayer Mark A | $170,000 | |
| Previous Owner | Rosebrugh Christopher P | $143,600 |
Source: Public Records
Tax History Compared to Growth
Tax History
| Year | Tax Paid | Tax Assessment Tax Assessment Total Assessment is a certain percentage of the fair market value that is determined by local assessors to be the total taxable value of land and additions on the property. | Land | Improvement |
|---|---|---|---|---|
| 2025 | $5,014 | $261,676 | -- | -- |
| 2024 | $4,881 | $254,055 | -- | -- |
| 2023 | $4,881 | $246,656 | $0 | $0 |
| 2022 | $4,597 | $239,472 | $0 | $0 |
| 2021 | $4,245 | $232,498 | $0 | $0 |
| 2020 | $4,139 | $225,727 | $0 | $0 |
| 2019 | $4,037 | $219,153 | $0 | $0 |
| 2018 | $3,839 | $212,770 | $0 | $0 |
| 2017 | $3,704 | $206,573 | $0 | $0 |
| 2016 | $3,372 | $200,556 | $0 | $0 |
| 2015 | $3,257 | $194,715 | $0 | $0 |
| 2014 | $3,215 | $189,044 | $0 | $0 |
Source: Public Records
Map
Nearby Homes