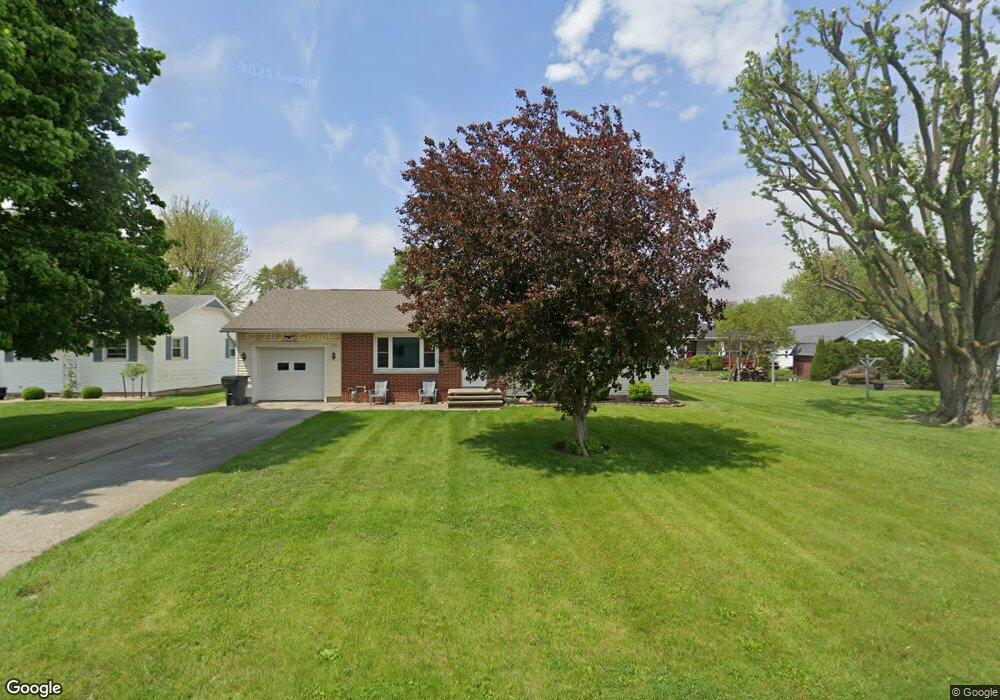
639 Davis St Delphos, OH 45833
Estimated Value: $139,000 - $216,000
3
Beds
2
Baths
1,288
Sq Ft
$128/Sq Ft
Est. Value
About This Home
This home is located at 639 Davis St, Delphos, OH 45833 and is currently estimated at $165,456, approximately $128 per square foot. 639 Davis St is a home located in Van Wert County with nearby schools including Delphos St. John's High School and Delphos St. John's Elementary School.
Ownership History
Date
Name
Owned For
Owner Type
Purchase Details
Closed on
Dec 14, 2012
Sold by
Brotherwood Neil and Brotherwood Kassandra
Bought by
Lindeman Christon M
Current Estimated Value
Home Financials for this Owner
Home Financials are based on the most recent Mortgage that was taken out on this home.
Original Mortgage
$73,600
Outstanding Balance
$50,604
Interest Rate
3.36%
Mortgage Type
New Conventional
Estimated Equity
$114,852
Purchase Details
Closed on
Jul 30, 2009
Sold by
Griffith Scott and Griffith Kerri R
Bought by
Brotherwood Neil and Brotherwood Kassandra
Home Financials for this Owner
Home Financials are based on the most recent Mortgage that was taken out on this home.
Original Mortgage
$90,780
Interest Rate
5.43%
Mortgage Type
Purchase Money Mortgage
Purchase Details
Closed on
Mar 20, 2003
Bought by
Moore Allen D and Moore Tammy L
Create a Home Valuation Report for This Property
The Home Valuation Report is an in-depth analysis detailing your home's value as well as a comparison with similar homes in the area
Home Values in the Area
Average Home Value in this Area
Purchase History
| Date | Buyer | Sale Price | Title Company |
|---|---|---|---|
| Lindeman Christon M | $92,000 | Attorney | |
| Brotherwood Neil | $89,000 | Attorney | |
| Moore Allen D | $37,100 | -- | |
| Moore Allen D | $37,100 | -- |
Source: Public Records
Mortgage History
| Date | Status | Borrower | Loan Amount |
|---|---|---|---|
| Open | Lindeman Christon M | $73,600 | |
| Previous Owner | Brotherwood Neil | $90,780 |
Source: Public Records
Tax History Compared to Growth
Tax History
| Year | Tax Paid | Tax Assessment Tax Assessment Total Assessment is a certain percentage of the fair market value that is determined by local assessors to be the total taxable value of land and additions on the property. | Land | Improvement |
|---|---|---|---|---|
| 2024 | $1,227 | $43,580 | $3,580 | $40,000 |
| 2023 | $1,227 | $43,580 | $3,580 | $40,000 |
| 2022 | $933 | $30,160 | $2,820 | $27,340 |
| 2021 | $936 | $30,160 | $2,820 | $27,340 |
| 2020 | $963 | $30,160 | $2,820 | $27,340 |
| 2019 | $774 | $27,000 | $2,820 | $24,180 |
| 2018 | $780 | $27,000 | $2,820 | $24,180 |
| 2017 | $781 | $27,000 | $2,820 | $24,180 |
| 2016 | $728 | $25,650 | $2,820 | $22,830 |
| 2015 | $728 | $25,650 | $2,820 | $22,830 |
| 2014 | $764 | $25,650 | $2,820 | $22,830 |
| 2013 | $815 | $25,650 | $2,820 | $22,830 |
Source: Public Records
Map
Nearby Homes
- 634 S Clay St
- 424 S Canal St
- 516 S Main St
- 221 S Main St
- 827 S Washington St
- 483 S Franklin St
- 1400 S Clay St Unit 17
- 409 N Bredeick St
- 210 E 3rd St
- 604 W 6th St
- 405 N Franklin St
- 633 E 2nd St
- 610 N Washington St
- 704 N Franklin St
- 810 N Franklin St
- 11630 Clearview Dr
- 521 Carolyn Dr
- 7110 Elida Rd
- 1303 Carolyn Dr
- 1220 Rose Anna Dr