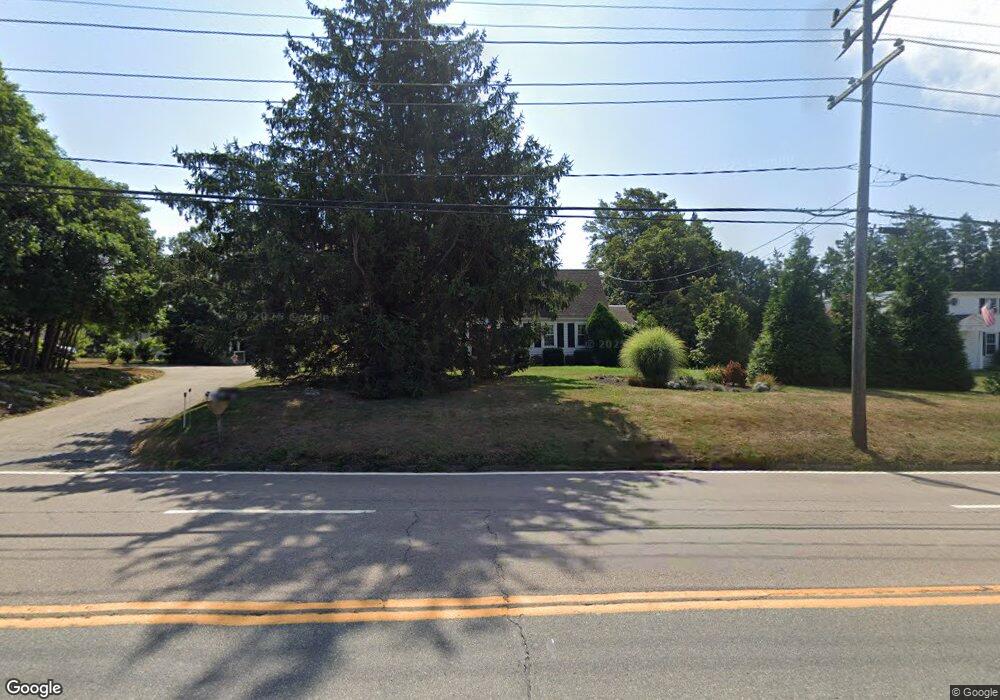
639 E Main Rd Middletown, RI 02842
Estimated Value: $883,552 - $996,000
4
Beds
3
Baths
2,895
Sq Ft
$321/Sq Ft
Est. Value
About This Home
This home is located at 639 E Main Rd, Middletown, RI 02842 and is currently estimated at $930,638, approximately $321 per square foot. 639 E Main Rd is a home located in Newport County with nearby schools including Middletown High School, All Saints STEAM Academy, and The Pennfield School.
Ownership History
Date
Name
Owned For
Owner Type
Purchase Details
Closed on
Aug 31, 2018
Sold by
Fragola Debra M
Bought by
Fragola Raphael C and Neverka Gregory J
Current Estimated Value
Purchase Details
Closed on
Dec 22, 2008
Sold by
Jarvis Joyce E
Bought by
Fragola Debra M
Home Financials for this Owner
Home Financials are based on the most recent Mortgage that was taken out on this home.
Original Mortgage
$250,000
Interest Rate
6.27%
Mortgage Type
Purchase Money Mortgage
Purchase Details
Closed on
Jun 2, 1993
Sold by
Jarvis Joyce E
Bought by
Caiger Hanna E
Create a Home Valuation Report for This Property
The Home Valuation Report is an in-depth analysis detailing your home's value as well as a comparison with similar homes in the area
Home Values in the Area
Average Home Value in this Area
Purchase History
| Date | Buyer | Sale Price | Title Company |
|---|---|---|---|
| Fragola Raphael C | -- | -- | |
| Fragola Debra M | $392,000 | -- | |
| Caiger Hanna E | $157,000 | -- |
Source: Public Records
Mortgage History
| Date | Status | Borrower | Loan Amount |
|---|---|---|---|
| Previous Owner | Caiger Hanna E | $250,000 | |
| Previous Owner | Caiger Hanna E | $173,000 | |
| Previous Owner | Caiger Hanna E | $100,000 | |
| Previous Owner | Caiger Hanna E | $66,000 |
Source: Public Records
Tax History
| Year | Tax Paid | Tax Assessment Tax Assessment Total Assessment is a certain percentage of the fair market value that is determined by local assessors to be the total taxable value of land and additions on the property. | Land | Improvement |
|---|---|---|---|---|
| 2025 | $7,329 | $621,600 | $282,300 | $339,300 |
| 2024 | $6,999 | $621,600 | $282,300 | $339,300 |
| 2023 | $5,697 | $452,500 | $161,600 | $290,900 |
| 2022 | $5,439 | $452,500 | $161,600 | $290,900 |
| 2021 | $5,439 | $452,500 | $161,600 | $290,900 |
| 2020 | $5,430 | $394,600 | $140,800 | $253,800 |
| 2018 | $5,426 | $394,600 | $140,800 | $253,800 |
| 2016 | $5,584 | $362,100 | $112,700 | $249,400 |
| 2015 | $5,446 | $362,100 | $112,700 | $249,400 |
| 2014 | $5,046 | $314,000 | $102,700 | $211,300 |
| 2013 | $4,933 | $314,000 | $102,700 | $211,300 |
Source: Public Records
Map
Nearby Homes
- 836 Forest Park
- 533 Forest Park
- 662 Forest Park
- 743 Forest Park
- 502 Forest Rd
- 16 Ward Ave
- 481 Oliphant Ln
- 223 Corey Ln
- 74 Valley Rd
- 310 Corey Ln
- 10 Smithfield Dr
- 81 Beagle Dr
- 318 Mitchell's Ln
- 476 Green End Ave
- 136 Corporate Place
- 126 Mitchells Ln
- 23 Indian Hill Cir
- 11 Barton Ln
- 51 Smythe St
- 35 Squantum Dr
Your Personal Tour Guide
Ask me questions while you tour the home.