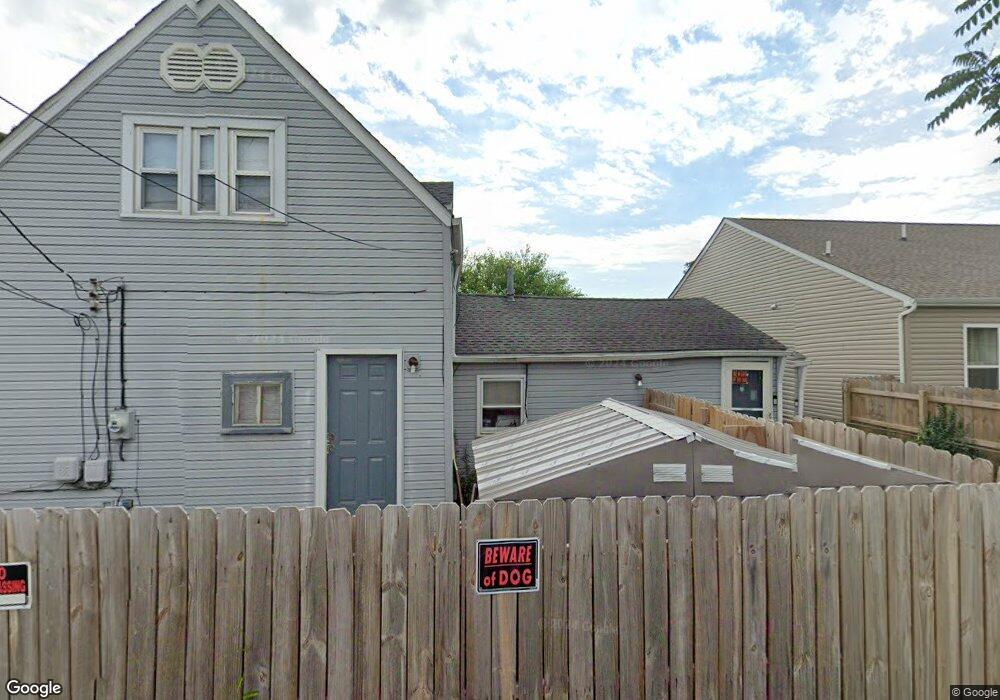
639 Elaine Rd Columbus, OH 43213
Estimated Value: $171,217 - $224,000
3
Beds
2
Baths
1,314
Sq Ft
$145/Sq Ft
Est. Value
About This Home
This home is located at 639 Elaine Rd, Columbus, OH 43213 and is currently estimated at $190,054, approximately $144 per square foot. 639 Elaine Rd is a home located in Franklin County with nearby schools including Etna Road Elementary School, Beechwood Elementary School, and Rosemore Middle School.
Ownership History
Date
Name
Owned For
Owner Type
Purchase Details
Closed on
Mar 15, 2019
Sold by
Tamcat Properties Llc
Bought by
Tnt Homes Llc
Current Estimated Value
Purchase Details
Closed on
Dec 19, 2018
Sold by
Gabriel Joe Celestine S and Gabriel Joe
Bought by
Tamcat Propoerties Llc
Purchase Details
Closed on
Dec 18, 2015
Sold by
Miller Nancy E and Morey Nancy E
Bought by
Watkins John
Purchase Details
Closed on
Oct 12, 1995
Sold by
Bell Martin H
Bought by
Celestine S Joe
Home Financials for this Owner
Home Financials are based on the most recent Mortgage that was taken out on this home.
Original Mortgage
$53,900
Interest Rate
7.8%
Mortgage Type
VA
Purchase Details
Closed on
Aug 30, 1994
Sold by
Pope Earsel
Bought by
Bell Martin H and Bell Virginia K
Create a Home Valuation Report for This Property
The Home Valuation Report is an in-depth analysis detailing your home's value as well as a comparison with similar homes in the area
Home Values in the Area
Average Home Value in this Area
Purchase History
| Date | Buyer | Sale Price | Title Company |
|---|---|---|---|
| Tnt Homes Llc | -- | None Available | |
| Tamcat Propoerties Llc | $39,000 | Pm Title Llc | |
| Watkins John | $65,000 | Land And Mortgage Title Box | |
| Celestine S Joe | $53,900 | -- | |
| Bell Martin H | $25,000 | -- |
Source: Public Records
Mortgage History
| Date | Status | Borrower | Loan Amount |
|---|---|---|---|
| Previous Owner | Celestine S Joe | $53,900 |
Source: Public Records
Tax History Compared to Growth
Tax History
| Year | Tax Paid | Tax Assessment Tax Assessment Total Assessment is a certain percentage of the fair market value that is determined by local assessors to be the total taxable value of land and additions on the property. | Land | Improvement |
|---|---|---|---|---|
| 2024 | $1,936 | $43,240 | $11,420 | $31,820 |
| 2023 | $1,922 | $43,225 | $11,410 | $31,815 |
| 2022 | $2,048 | $35,000 | $5,040 | $29,960 |
| 2021 | $1,926 | $35,000 | $5,040 | $29,960 |
| 2020 | $1,907 | $35,000 | $5,040 | $29,960 |
| 2019 | $1,756 | $28,010 | $4,030 | $23,980 |
| 2018 | $2,105 | $28,010 | $4,030 | $23,980 |
| 2017 | $1,919 | $28,010 | $4,030 | $23,980 |
| 2016 | $1,719 | $19,190 | $5,780 | $13,410 |
| 2015 | $1,300 | $19,190 | $5,780 | $13,410 |
| 2014 | $1,300 | $19,190 | $5,780 | $13,410 |
| 2013 | $667 | $20,685 | $6,405 | $14,280 |
Source: Public Records
Map
Nearby Homes
- 579 Westphal Ave
- 798 S Yearling Rd
- 4094 E Main St
- 451 Beaver Ave
- 4148 Elbern Ave
- 4144 Mcallister Ave
- 963 Erickson Ave
- 4368 Broadhurst Dr
- 571 S Hamilton Rd
- 4653 Kae Ave
- 4489 Saint Margaret Ln
- 4662 Jae Ave
- 1085 S Hamilton Rd
- 1068 Ross Rd
- 3811 Brentwood Ct
- 353 Shell Ct E
- 4780 Etna Rd Unit 782
- 469 Cumberland Dr
- 3955 E Fulton St
- 4572 Saint Anthony Ln
- 631 Elaine Rd
- 645 Elaine Rd
- 625 Elaine Rd
- 651 Elaine Rd
- 632 S Yearling Rd
- 657 Elaine Rd
- 640 Elaine Rd Unit 642
- 640-642 Elaine Rd
- 644 S Yearling Rd
- 646 Elaine Rd Unit 648
- 646-648 Elaine Rd
- 632 Elaine Rd
- 617 Elaine Rd
- 663 Elaine Rd
- 652 Elaine Rd
- 626 Elaine Rd
- 652 S Yearling Rd
- 604 S Yearling Rd
- 662 Elaine Rd
- 612 Elaine Rd