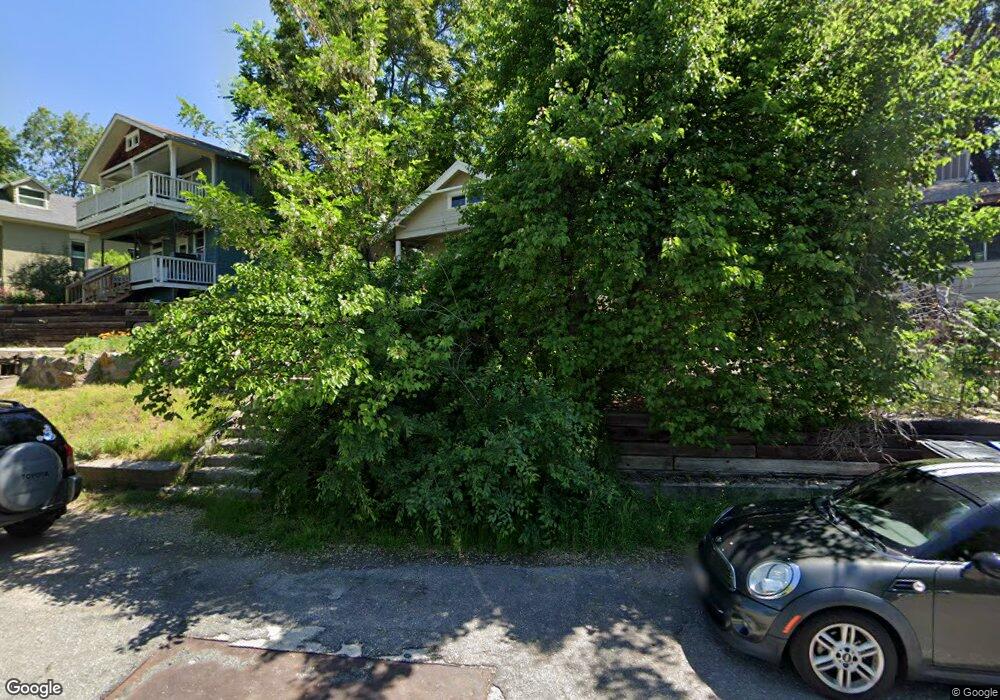
639 Grand St Salt Lake City, UT 84102
East Central NeighborhoodEstimated Value: $462,596 - $536,000
2
Beds
1
Bath
888
Sq Ft
$550/Sq Ft
Est. Value
About This Home
This home is located at 639 Grand St, Salt Lake City, UT 84102 and is currently estimated at $488,149, approximately $549 per square foot. 639 Grand St is a home located in Salt Lake County with nearby schools including Bennion Elementary School, Wasatch Elementary School, and East High School.
Ownership History
Date
Name
Owned For
Owner Type
Purchase Details
Closed on
Dec 21, 2002
Sold by
Vonvimar Maria I
Bought by
Poli Michael
Current Estimated Value
Home Financials for this Owner
Home Financials are based on the most recent Mortgage that was taken out on this home.
Original Mortgage
$61,500
Outstanding Balance
$25,694
Interest Rate
5.86%
Mortgage Type
Seller Take Back
Estimated Equity
$462,455
Create a Home Valuation Report for This Property
The Home Valuation Report is an in-depth analysis detailing your home's value as well as a comparison with similar homes in the area
Home Values in the Area
Average Home Value in this Area
Purchase History
| Date | Buyer | Sale Price | Title Company |
|---|---|---|---|
| Poli Michael | -- | -- | |
| Vonvimar Maria I | -- | -- |
Source: Public Records
Mortgage History
| Date | Status | Borrower | Loan Amount |
|---|---|---|---|
| Open | Poli Michael | $61,500 |
Source: Public Records
Tax History Compared to Growth
Tax History
| Year | Tax Paid | Tax Assessment Tax Assessment Total Assessment is a certain percentage of the fair market value that is determined by local assessors to be the total taxable value of land and additions on the property. | Land | Improvement |
|---|---|---|---|---|
| 2025 | $1,836 | $349,300 | $158,800 | $190,500 |
| 2024 | $1,836 | $350,300 | $150,200 | $200,100 |
| 2023 | $1,876 | $345,000 | $144,400 | $200,600 |
| 2022 | $2,031 | $350,500 | $141,600 | $208,900 |
| 2021 | $1,996 | $311,900 | $108,700 | $203,200 |
| 2020 | $1,525 | $226,700 | $98,800 | $127,900 |
| 2019 | $1,880 | $263,000 | $93,100 | $169,900 |
| 2018 | $1,684 | $229,400 | $93,100 | $136,300 |
| 2017 | $1,645 | $209,900 | $93,100 | $116,800 |
| 2016 | $1,695 | $205,400 | $76,400 | $129,000 |
| 2015 | $1,634 | $187,700 | $59,000 | $128,700 |
| 2014 | $1,578 | $179,800 | $57,800 | $122,000 |
Source: Public Records
Map
Nearby Homes
- 915 E 600 S
- 531 S 900 E Unit B3
- 606 S 900 E
- 525 S 900 E Unit B2
- 543 S 900 E Unit A11
- 552 S Mcclelland St
- 551 S Mcclelland St
- 515 S 1000 E Unit 706
- 515 S 1000 E Unit 406
- 515 S 1000 E Unit 1104
- 515 S 1000 E Unit 504
- 938 E Lowell Ave
- 504 S 900 E
- 1011 E 800 S
- 1021 E 800 S
- 1031 E 800 S
- 1117 E 700 S
- 717 S 800 E
- 426 S 1000 E Unit 600
- 426 S 1000 E Unit 707