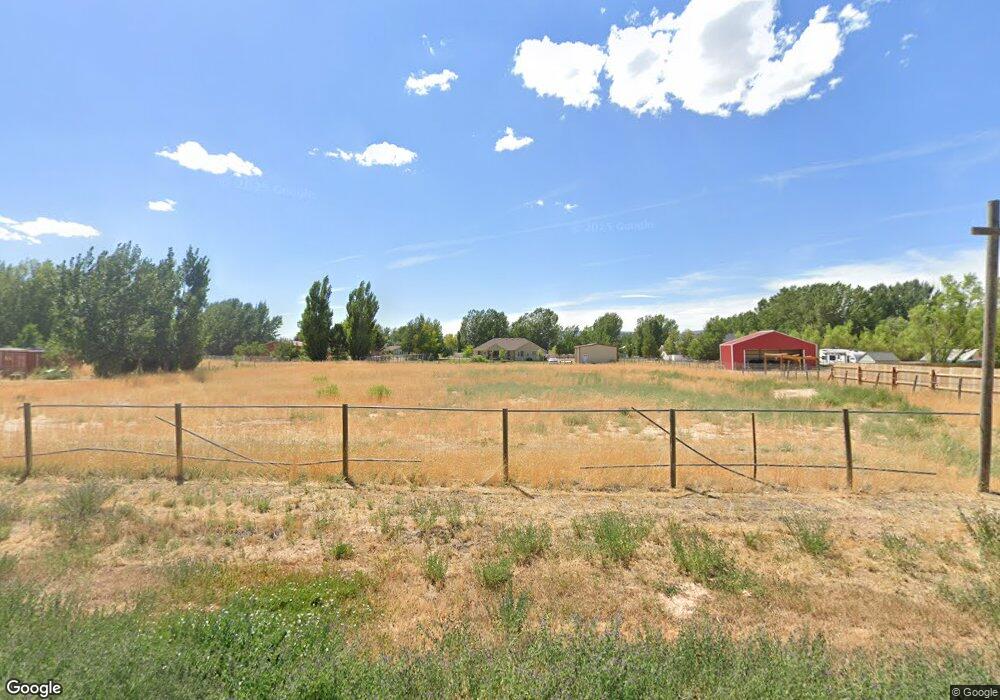
639 N 4275 W Cedar City, UT 84721
Estimated Value: $116,000 - $463,000
--
Bed
--
Bath
43,560
Sq Ft
$5/Sq Ft
Est. Value
About This Home
This home is located at 639 N 4275 W, Cedar City, UT 84721 and is currently estimated at $213,206, approximately $4 per square foot. 639 N 4275 W is a home located in Iron County with nearby schools including Iron Springs School, Cedar Middle School, and Cedar City High School.
Ownership History
Date
Name
Owned For
Owner Type
Purchase Details
Closed on
Oct 2, 2020
Sold by
Mccoy Gail Thomas and Mccoy Mindy
Bought by
Barlow Brian
Current Estimated Value
Home Financials for this Owner
Home Financials are based on the most recent Mortgage that was taken out on this home.
Original Mortgage
$30,000
Outstanding Balance
$26,683
Interest Rate
2.9%
Mortgage Type
Seller Take Back
Estimated Equity
$186,523
Purchase Details
Closed on
Jul 14, 2017
Sold by
Wren Justiri Keith
Bought by
Mccoy Gail Thomas and Mccoy Mindy
Home Financials for this Owner
Home Financials are based on the most recent Mortgage that was taken out on this home.
Original Mortgage
$42,400
Interest Rate
3.94%
Mortgage Type
Commercial
Create a Home Valuation Report for This Property
The Home Valuation Report is an in-depth analysis detailing your home's value as well as a comparison with similar homes in the area
Home Values in the Area
Average Home Value in this Area
Purchase History
| Date | Buyer | Sale Price | Title Company |
|---|---|---|---|
| Barlow Brian | -- | Mountain View Ttl St George | |
| Mccoy Gail Thomas | -- | Security Escrow & Title Insu |
Source: Public Records
Mortgage History
| Date | Status | Borrower | Loan Amount |
|---|---|---|---|
| Open | Barlow Brian | $30,000 | |
| Previous Owner | Mccoy Gail Thomas | $42,400 |
Source: Public Records
Tax History Compared to Growth
Tax History
| Year | Tax Paid | Tax Assessment Tax Assessment Total Assessment is a certain percentage of the fair market value that is determined by local assessors to be the total taxable value of land and additions on the property. | Land | Improvement |
|---|---|---|---|---|
| 2025 | $695 | $89,107 | $89,107 | -- |
| 2023 | $1,389 | $142,570 | $142,570 | $0 |
| 2022 | $981 | $109,670 | $109,670 | $0 |
| 2021 | $613 | $68,540 | $68,540 | $0 |
| 2020 | $577 | $57,120 | $57,120 | $0 |
| 2019 | $527 | $50,000 | $50,000 | $0 |
| 2018 | $539 | $50,000 | $50,000 | $0 |
| 2017 | $484 | $45,000 | $45,000 | $0 |
| 2016 | $358 | $30,000 | $30,000 | $0 |
| 2015 | $313 | $25,000 | $0 | $0 |
| 2014 | $331 | $25,000 | $0 | $0 |
Source: Public Records
Map
Nearby Homes