639 Oakland Way Unit 6 Lawrenceville, GA 30044
Gwinnett Place NeighborhoodEstimated Value: $313,000 - $330,000
3
Beds
2
Baths
1,419
Sq Ft
$226/Sq Ft
Est. Value
About This Home
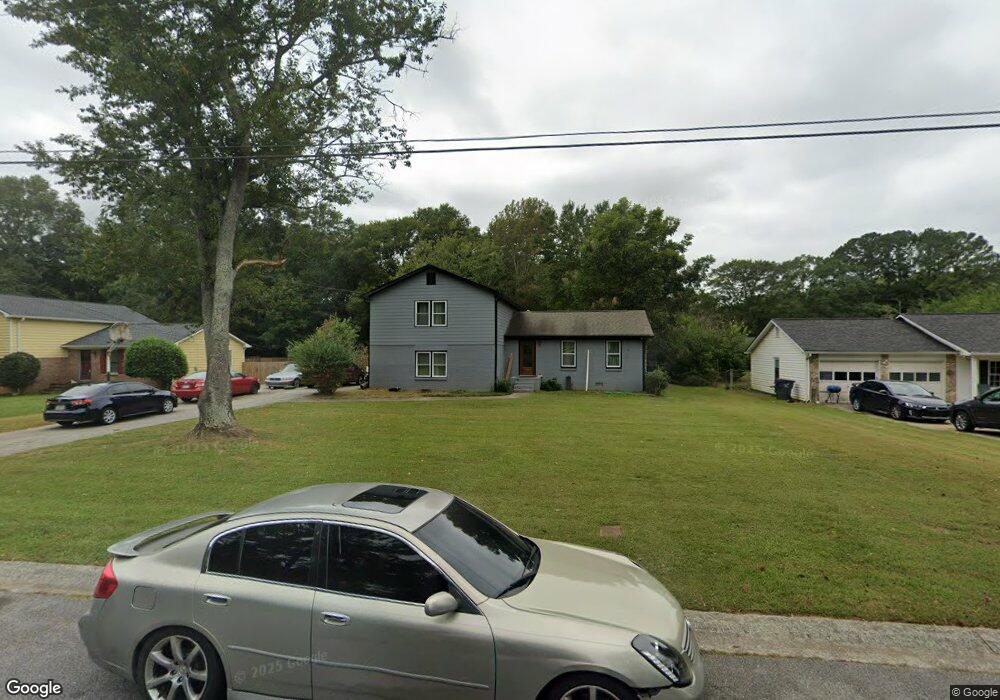
This home is located at 639 Oakland Way Unit 6, Lawrenceville, GA 30044 and is currently estimated at $321,088, approximately $226 per square foot. 639 Oakland Way Unit 6 is a home located in Gwinnett County with nearby schools including Benefield Elementary School, Richards Middle School, and Discovery High School.
Ownership History
Date
Name
Owned For
Owner Type
Purchase Details
Closed on
Feb 15, 2021
Sold by
Ramirez Daniel Mendoza
Bought by
Hernandez Keniz Mendoza and Aragon William
Current Estimated Value
Purchase Details
Closed on
Aug 23, 2005
Sold by
Guzman Andreina
Bought by
Ramirez Daniel M
Home Financials for this Owner
Home Financials are based on the most recent Mortgage that was taken out on this home.
Original Mortgage
$127,991
Interest Rate
5.61%
Mortgage Type
VA
Purchase Details
Closed on
Jul 31, 2002
Sold by
Chakrabarty Debabrata
Bought by
Guzman Andreina
Home Financials for this Owner
Home Financials are based on the most recent Mortgage that was taken out on this home.
Original Mortgage
$133,800
Interest Rate
6.52%
Mortgage Type
New Conventional
Purchase Details
Closed on
Aug 27, 1999
Sold by
Wall Dennis A and Wall Nanette E
Bought by
Hamann James
Home Financials for this Owner
Home Financials are based on the most recent Mortgage that was taken out on this home.
Original Mortgage
$107,822
Interest Rate
7.58%
Mortgage Type
FHA
Create a Home Valuation Report for This Property
The Home Valuation Report is an in-depth analysis detailing your home's value as well as a comparison with similar homes in the area
Home Values in the Area
Average Home Value in this Area
Purchase History
| Date | Buyer | Sale Price | Title Company |
|---|---|---|---|
| Hernandez Keniz Mendoza | -- | -- | |
| Ramirez Daniel M | $130,000 | -- | |
| Guzman Andreina | $138,500 | -- | |
| Hamann James | $111,000 | -- |
Source: Public Records
Mortgage History
| Date | Status | Borrower | Loan Amount |
|---|---|---|---|
| Previous Owner | Ramirez Daniel M | $127,991 | |
| Previous Owner | Guzman Andreina | $133,800 | |
| Previous Owner | Hamann James | $107,822 |
Source: Public Records
Tax History Compared to Growth
Tax History
| Year | Tax Paid | Tax Assessment Tax Assessment Total Assessment is a certain percentage of the fair market value that is determined by local assessors to be the total taxable value of land and additions on the property. | Land | Improvement |
|---|---|---|---|---|
| 2024 | $4,450 | $113,840 | $21,120 | $92,720 |
| 2023 | $4,450 | $111,320 | $26,000 | $85,320 |
| 2022 | $3,739 | $94,960 | $22,000 | $72,960 |
| 2021 | $981 | $69,600 | $15,200 | $54,400 |
| 2020 | $979 | $69,600 | $15,200 | $54,400 |
| 2019 | $2,255 | $63,640 | $14,120 | $49,520 |
| 2018 | $2,262 | $64,040 | $11,920 | $52,120 |
| 2016 | $1,830 | $47,880 | $10,400 | $37,480 |
| 2015 | $1,335 | $33,720 | $10,400 | $23,320 |
| 2014 | -- | $33,720 | $10,400 | $23,320 |
Source: Public Records
Map
Nearby Homes
- 2023 S Oak Dr Unit 5
- 2014 Poplar Ridge
- 1851 Stoney Chase Dr
- 2035 Northland Dr
- 519 Granite Ct NW
- 1766 Stoney Chase Dr
- 2204 Oakland Dr
- 2185 Valley Wood Dr
- 330 Pebble Chase Ln
- 665 Shannon Way
- 1980 Champions Pkwy
- 1847 Oak Ridge Ln Unit 4
- 2306 Kemp Dr
- 586 Chris Cir
- 904 Steffi Ct Unit 3
- 747 Ohara Ct
- 442 Edwards Ct
- 649 Oakland Way
- 629 Oakland Way Unit 6
- 630 Oakland Rd
- 659 Oakland Way
- 640 Oakland Rd Unit 6
- 620 Oakland Rd
- 2054 Wisteria Ct
- 2083 S Oak Dr
- 650 Oakland Rd
- 2053 S Oak Dr
- 2093 S Oak Dr
- 669 Oakland Way
- 0 Wisteria Ct NW Unit 8665453
- 0 Wisteria Ct NW Unit 7326204
- 0 Wisteria Ct NW Unit 8769799
- 0 Wisteria Ct NW Unit 7588618
- 0 Wisteria Ct NW
- 2055 Wisteria Ct
- 2044 Wisteria Ct Unit 6
- 0 Oakland Way NW