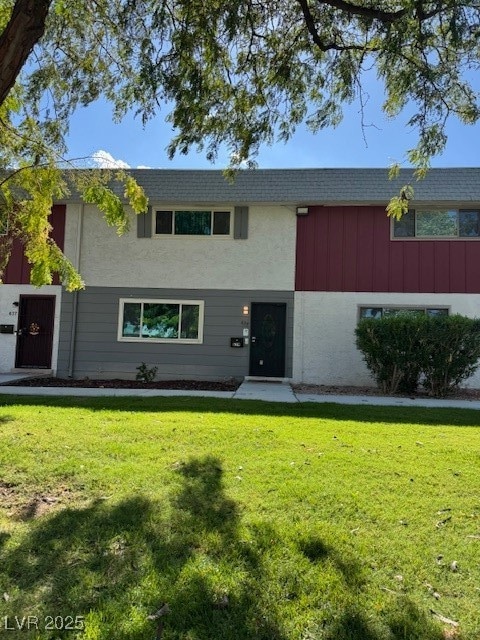
639 Pecos Way Unit 5 Las Vegas, NV 89121
Highlights
- Community Pool
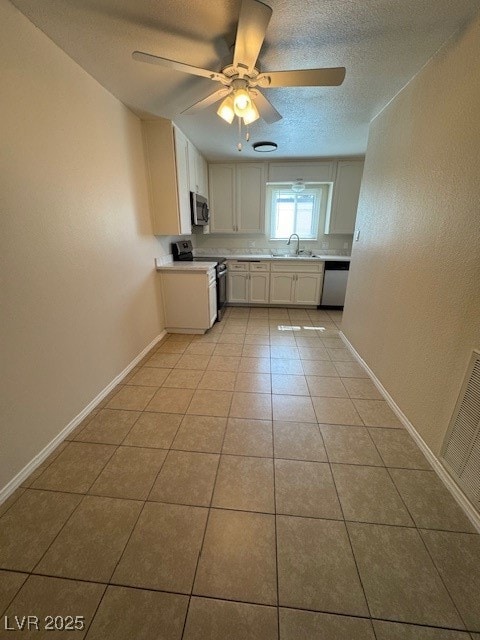
- Ceramic Tile Flooring
- Ceiling Fan
- Tennis Courts
- Central Heating and Cooling System
- 2 Car Garage
About This Home
Welcome to this beautifully maintained 2-bedroom, 2.5-bath townhome nestled in a well-kept Las Vegas community.
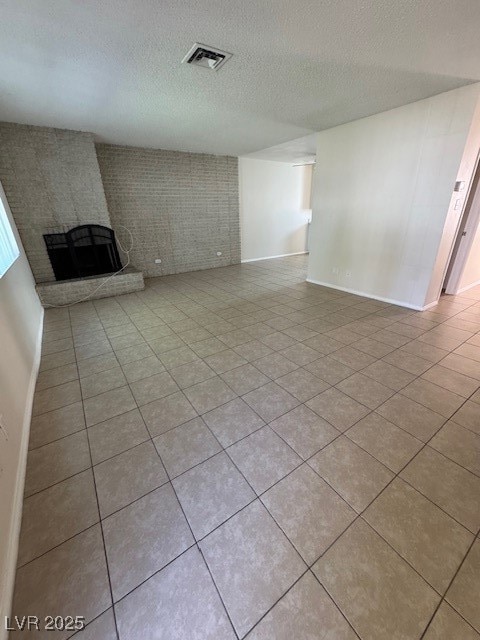
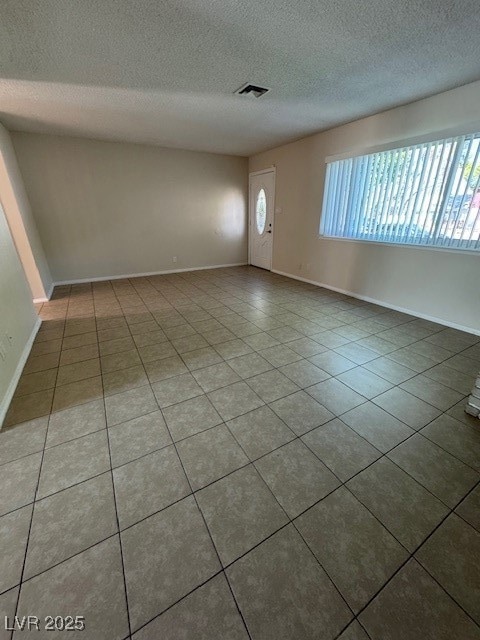
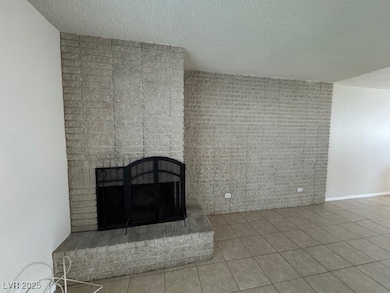
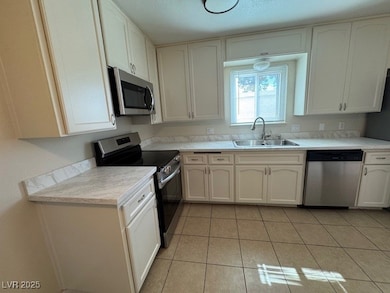
Step inside to a bright and open-concept floor plan designed for comfortable living. The spacious living room features a charming corner fireplace, creating a cozy focal point for relaxing or entertaining. The kitchen is equipped with stainless steel appliances and flows effortlessly into the combined living and dining area—ideal for hosting guests or enjoying quiet evenings at home.
Upstairs, you'll find two generously sized bedrooms, each offering plenty of space and natural light. A detached two-car garage provides added convenience, extra storage, and enhanced privacy.
Enjoy your own private, enclosed patio—complete with a built-in BBQ—perfect for weekend cookouts, outdoor dining, or unwinding under the desert sky.
Residents have access to meticulously landscaped community amenities, including a sparkling pool, soothing spa, and well-maintained tennis courts.
Listing Agent
SMS Realty Group Brokerage Phone: 702-743-5862 License #B.0143723 Listed on: 10/04/2025
Townhouse Details
Home Type
- Townhome
Est. Annual Taxes
- $667
Year Built
- Built in 1969
Lot Details
- 1,742 Sq Ft Lot
- West Facing Home
- Back Yard Fenced
- Block Wall Fence
Parking
- 2 Car Garage
Home Design
- Frame Construction
- Pitched Roof
- Tile Roof
- Stucco
Interior Spaces
- 1,320 Sq Ft Home
- 2-Story Property
- Ceiling Fan
- Wood Burning Fireplace
- Blinds
- Living Room with Fireplace
Kitchen
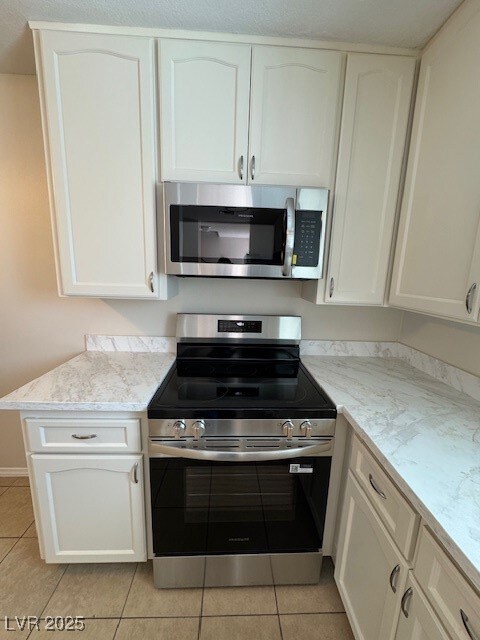
- Electric Oven
- Electric Range
- Microwave
- Dishwasher
- Disposal
Flooring
- Laminate
- Ceramic Tile
Bedrooms and Bathrooms
- 2 Bedrooms
Laundry
- Laundry on main level
- Washer and Dryer
Schools
- Beckley Elementary School
- Mack Jerome Middle School
- Chaparral High School
Utilities
- Central Heating and Cooling System
- Heating System Uses Gas
- Cable TV Available
Listing and Financial Details
- Security Deposit $1,650
- Property Available on 10/6/25
- Tenant pays for cable TV, electricity, gas, sewer, trash collection, water
Community Details
Overview
- Property has a Home Owners Association
- Greenbriar Association, Phone Number (702) 736-9450
- Greenbriar Twnhs Subdivision
- The community has rules related to covenants, conditions, and restrictions
Recreation
- Tennis Courts
- Community Pool
- Community Spa
Pet Policy
- Call for details about the types of pets allowed
Map
Source: Las Vegas REALTORS®
MLS Number: 2724860
APN: 161-07-312-022
Disclaimer: Certain information contained herein is derived from information provided by parties other than Homes.com. All information provided is deemed reliable, but is not guaranteed to be accurate and should be independently verified.
![]() The data relating to real estate for sale on this web site comes in part from the INTERNET DATA EXCHANGE Program of the Greater Las Vegas Association of REALTORS® MLS. Real estate listings held by brokerage firms other than this site owner are marked with the IDX logo. Information is deemed reliable but not guaranteed. Copyright 2025 of the Greater Las Vegas Association of REALTORS® MLS. All rights reserved.
The data relating to real estate for sale on this web site comes in part from the INTERNET DATA EXCHANGE Program of the Greater Las Vegas Association of REALTORS® MLS. Real estate listings held by brokerage firms other than this site owner are marked with the IDX logo. Information is deemed reliable but not guaranteed. Copyright 2025 of the Greater Las Vegas Association of REALTORS® MLS. All rights reserved.
- 652 Greenbriar Townhouse Way
- 3085 Greenbriar Dr
- 335 Greenbriar Townhouse Way
- 431 Las Casitas Way
- 747 Greenbriar Townhouse Way
- 275 Pecos Way
- 231 Greenbriar Townhouse Way
- 241 Pecos Way Unit 6
- 171 Greenbriar Townhouse Way
- 233 Pecos Way
- 3453 Del Marino Dr
- 3169 Nottingham Dr
- 3435 Don Miguel Dr
- 3439 Del Marino Dr
- 3428 Don Miguel Dr
- 163 Greenbriar Townhouse Way
- 146 Greenbriar Townhouse Way
- 169 Pecos Way
- 150 Greenbriar Townhouse Way
- 3642 Boulder Hwy Unit 264
- 426 Greenbriar Townhouse Way
- 3642 Boulder Hwy Unit 168
- 3642 Boulder Hwy Unit 264
- 3642 Boulder Hwy Unit 229
- 158 Greenbriar Townhouse Way
- 3225 S Pecos Rd
- 3210 S Sandhill Rd
- 2974 Torreon Ln
- 2990 Saltillo Ln
- 4040 Boulder Hwy
- 3463 Monte Carlo Dr
- 2691 Aracatuba Ave
- 3135 S Mojave Rd Unit 257
- 3135 S Mojave Rd Unit 218
- 3135 S Mojave Rd Unit 246
- 3135 S Mojave Rd Unit 241
- 2692 Matogroso Ln
- 2658 Ruthe Duarte Ave Unit 1
- 3211 S Heritage Way
- 3280 Dayflower St Unit 1
