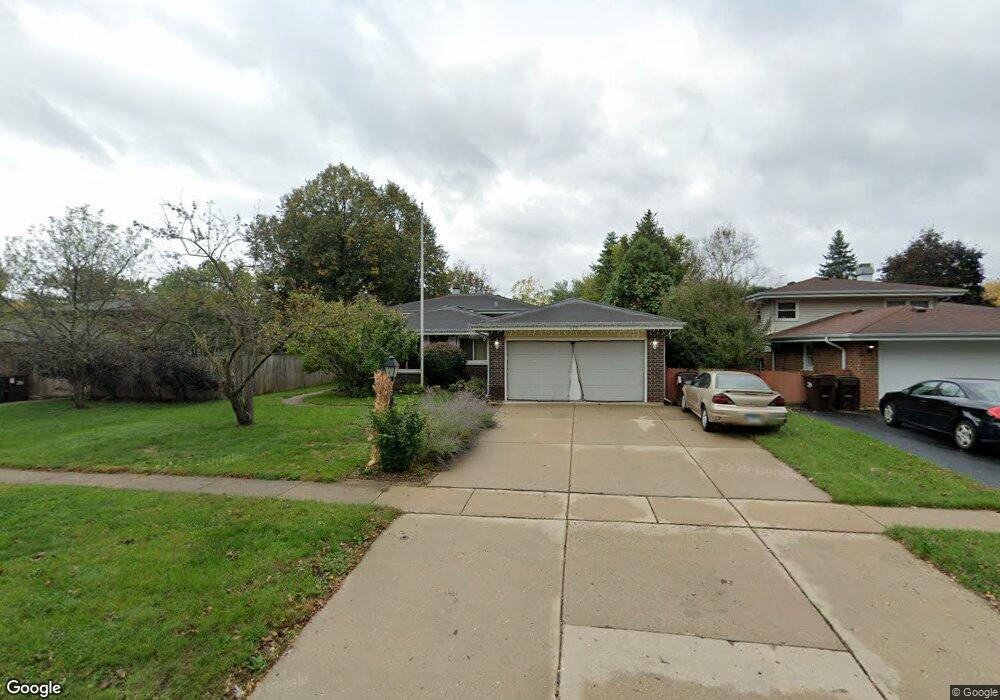
639 Sharon Dr Crystal Lake, IL 60014
Estimated Value: $298,050 - $349,000
3
Beds
2
Baths
1,228
Sq Ft
$265/Sq Ft
Est. Value
About This Home
This home is located at 639 Sharon Dr, Crystal Lake, IL 60014 and is currently estimated at $326,013, approximately $265 per square foot. 639 Sharon Dr is a home located in McHenry County with nearby schools including Coventry Elementary School, Hannah Beardsley Middle School, and Crystal Lake Central High School.
Ownership History
Date
Name
Owned For
Owner Type
Purchase Details
Closed on
Oct 5, 2021
Sold by
Samano Oscar and Samano Denise
Bought by
Samano Oscar and Samano Denise M
Current Estimated Value
Purchase Details
Closed on
Aug 16, 2000
Sold by
Sharp Christopher R and Sharp Sheila D
Bought by
Mulligan Deloris A
Home Financials for this Owner
Home Financials are based on the most recent Mortgage that was taken out on this home.
Original Mortgage
$130,800
Outstanding Balance
$47,226
Interest Rate
8.16%
Estimated Equity
$278,787
Purchase Details
Closed on
Nov 24, 1993
Sold by
Burke John D and Burke Dawn M
Bought by
Sharp Christopher R and Sharp Sheila D
Home Financials for this Owner
Home Financials are based on the most recent Mortgage that was taken out on this home.
Original Mortgage
$130,350
Interest Rate
5.5%
Mortgage Type
FHA
Create a Home Valuation Report for This Property
The Home Valuation Report is an in-depth analysis detailing your home's value as well as a comparison with similar homes in the area
Home Values in the Area
Average Home Value in this Area
Purchase History
| Date | Buyer | Sale Price | Title Company |
|---|---|---|---|
| Samano Oscar | -- | None Available | |
| Mulligan Deloris A | $163,500 | Universal Title Services Inc | |
| Sharp Christopher R | $132,500 | Universal Title Services Inc |
Source: Public Records
Mortgage History
| Date | Status | Borrower | Loan Amount |
|---|---|---|---|
| Open | Mulligan Deloris A | $130,800 | |
| Previous Owner | Sharp Christopher R | $130,350 |
Source: Public Records
Tax History Compared to Growth
Tax History
| Year | Tax Paid | Tax Assessment Tax Assessment Total Assessment is a certain percentage of the fair market value that is determined by local assessors to be the total taxable value of land and additions on the property. | Land | Improvement |
|---|---|---|---|---|
| 2024 | $7,314 | $94,389 | $17,307 | $77,082 |
| 2023 | $7,036 | $84,419 | $15,479 | $68,940 |
| 2022 | $6,632 | $76,012 | $16,314 | $59,698 |
| 2021 | $6,260 | $70,814 | $15,198 | $55,616 |
| 2020 | $6,096 | $68,307 | $14,660 | $53,647 |
| 2019 | $5,928 | $65,378 | $14,031 | $51,347 |
| 2018 | $5,358 | $58,613 | $17,031 | $41,582 |
| 2017 | $5,313 | $55,217 | $16,044 | $39,173 |
| 2016 | $5,164 | $51,789 | $15,048 | $36,741 |
| 2013 | -- | $53,521 | $14,038 | $39,483 |
Source: Public Records
Map
Nearby Homes
- 600 Sussex Ln
- 698 Sussex Ln
- 511 Coventry Ln Unit 2
- 511 Coventry Ln Unit 3
- 501 Coventry Ln Unit 18
- 567 Cress Creek Ln
- 480 Westwood Ct Unit C
- 699 Darlington Ln
- 421 Lake Ave
- 650 Cress Creek Ln Unit 1
- 221 Uteg St Unit G
- 293 Wellington Dr
- 458 Lake Ave
- 704 Saint Andrews Ln
- 584 Somerset Ln Unit 5
- 860 Darlington Ln
- 407 Keith Ave
- 615 Lake Ave
- 310 2nd Ct
- 691 Lake Ave
- 629 Sharon Dr
- 649 Sharon Dr
- 640 Chardonnay Ln
- 623 Sharon Dr
- 630 Chardonnay Ln
- 640 Eletson Dr
- 622 Chardonnay Ln
- 640 Sharon Dr
- 630 Sharon Dr
- 648 Sharon Dr
- 624 Sharon Dr
- 614 Chardonnay Ln
- 611 Sharon Dr
- 614 Eletson Dr
- 618 Sharon Dr
- 635 Eletson Dr
- 629 Chardonnay Ln Unit 1
- 637 Chardonnay Ln Unit 639
- 639 Eletson Dr
- 649 Chardonnay Ln