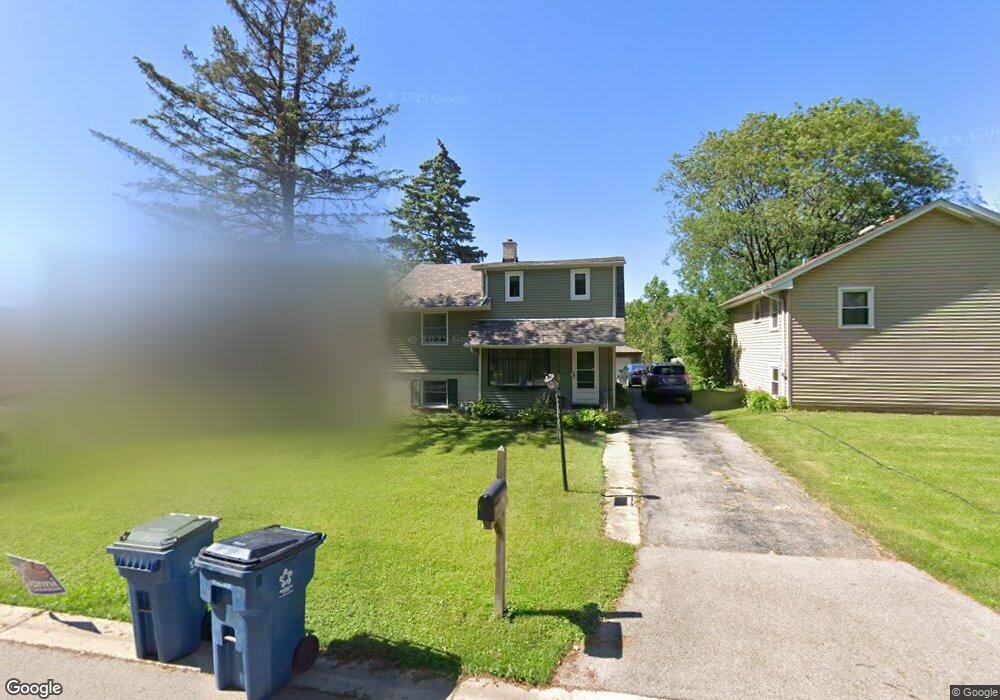
639 W Fay Ave Elmhurst, IL 60126
Estimated Value: $414,533 - $509,000
--
Bed
1
Bath
1,374
Sq Ft
$330/Sq Ft
Est. Value
About This Home
This home is located at 639 W Fay Ave, Elmhurst, IL 60126 and is currently estimated at $453,383, approximately $329 per square foot. 639 W Fay Ave is a home located in DuPage County with nearby schools including Emerson Elementary School, Churchville Middle School, and York Community High School.
Ownership History
Date
Name
Owned For
Owner Type
Purchase Details
Closed on
Dec 23, 2020
Sold by
Sloma Allen and Allen Sloma Trust
Bought by
Sloma Allen M and Sloma Karen L
Current Estimated Value
Home Financials for this Owner
Home Financials are based on the most recent Mortgage that was taken out on this home.
Original Mortgage
$183,109
Interest Rate
2.25%
Mortgage Type
New Conventional
Purchase Details
Closed on
Nov 11, 2010
Sold by
Sloma Allen and Sloma Karen
Bought by
Sloma Allen and Sloma Karen
Purchase Details
Closed on
Dec 31, 1996
Sold by
Reddington Geoffrey and Armstrong Sara
Bought by
Sloma Allen and Sloma Karen
Home Financials for this Owner
Home Financials are based on the most recent Mortgage that was taken out on this home.
Original Mortgage
$110,000
Interest Rate
7.66%
Create a Home Valuation Report for This Property
The Home Valuation Report is an in-depth analysis detailing your home's value as well as a comparison with similar homes in the area
Home Values in the Area
Average Home Value in this Area
Purchase History
| Date | Buyer | Sale Price | Title Company |
|---|---|---|---|
| Sloma Allen M | -- | First American Title | |
| Sloma Allen | -- | None Available | |
| Sloma Allen | $139,000 | -- |
Source: Public Records
Mortgage History
| Date | Status | Borrower | Loan Amount |
|---|---|---|---|
| Open | Sloma Allen M | $183,109 | |
| Previous Owner | Sloma Allen M | $183,109 | |
| Previous Owner | Sloma Allen | $110,000 |
Source: Public Records
Tax History Compared to Growth
Tax History
| Year | Tax Paid | Tax Assessment Tax Assessment Total Assessment is a certain percentage of the fair market value that is determined by local assessors to be the total taxable value of land and additions on the property. | Land | Improvement |
|---|---|---|---|---|
| 2024 | $7,445 | $129,568 | $71,501 | $58,067 |
| 2023 | $6,857 | $119,110 | $65,730 | $53,380 |
| 2022 | $6,543 | $112,820 | $62,300 | $50,520 |
| 2021 | $6,260 | $108,060 | $59,670 | $48,390 |
| 2020 | $5,886 | $103,500 | $57,150 | $46,350 |
| 2019 | $5,822 | $99,520 | $54,950 | $44,570 |
| 2018 | $5,364 | $91,640 | $52,340 | $39,300 |
| 2017 | $5,254 | $87,580 | $50,020 | $37,560 |
| 2016 | $5,024 | $80,860 | $46,180 | $34,680 |
| 2015 | $4,917 | $74,700 | $42,660 | $32,040 |
| 2014 | $4,565 | $64,630 | $35,200 | $29,430 |
| 2013 | $4,549 | $65,950 | $35,920 | $30,030 |
Source: Public Records
Map
Nearby Homes
- 656 W Comstock Ave
- 655 W Comstock Ave
- 600 E Armitage Ave
- 901 E Krage Dr
- 468 N Highland Ave
- 412 N Ridgeland Ave
- 902 E Krage Dr
- 442 N Oak St
- 724 N Junior Terrace
- 322 N Highland Ave
- 407 W North Ave
- 285 N Ridgeland Ave
- 437 E Lorraine Ave
- 284 N Highland Ave
- 204 E Hill St
- 1101 N Princeton Ave
- 17W517 Manor Ln
- 1018 N Princeton Ave
- 625 S Yale Ave
- 251 W Armitage Ave
- 647 W Fay Ave
- 635 W Fay Ave
- 651 W Fay Ave
- 653 W Fay Ave
- 646 W Armitage Ave
- 636 W Armitage Ave
- 640 W Armitage Ave
- 619 W Fay Ave
- 632 W Armitage Ave
- 650 W Armitage Ave
- 655 W Fay Ave
- 473 N Garden Ave
- 624 W Armitage Ave
- 654 W Armitage Ave
- 620 W Armitage Ave
- 617 W Fay Ave
- 615 W Fay Ave
- 660 W Armitage Ave
- 616 W Armitage Ave
- 611 W Fay Ave