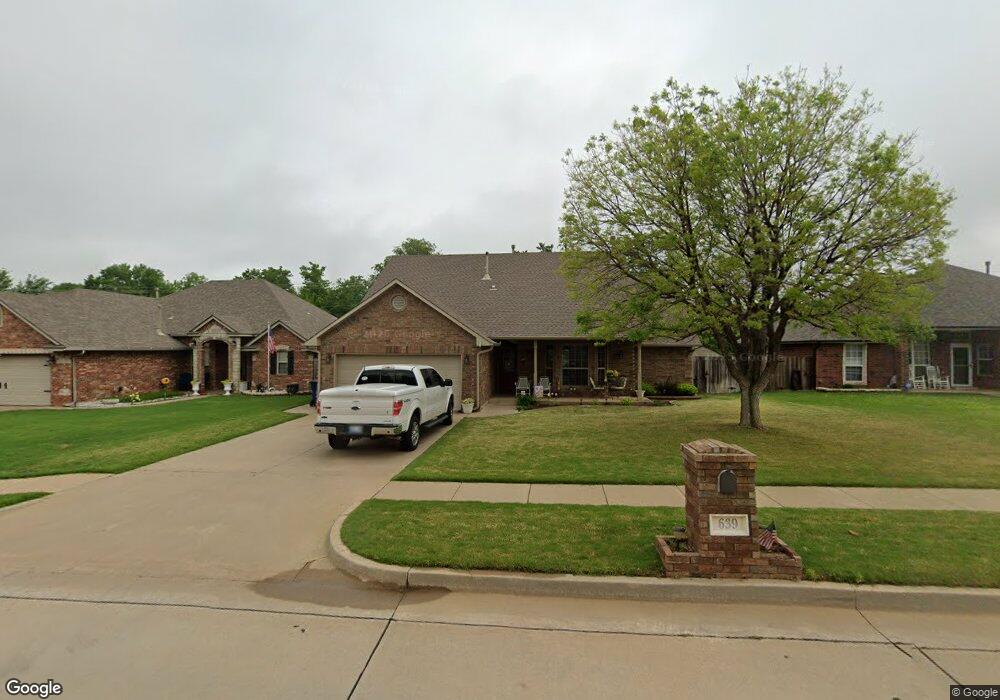
639 W Geronimo Way Mustang, OK 73064
Estimated Value: $280,620 - $294,000
3
Beds
2
Baths
2,067
Sq Ft
$140/Sq Ft
Est. Value
About This Home
This home is located at 639 W Geronimo Way, Mustang, OK 73064 and is currently estimated at $289,405, approximately $140 per square foot. 639 W Geronimo Way is a home located in Canadian County with nearby schools including Mustang Lakehoma Elementary School, Mustang Horizon Intermediate School, and Mustang Middle School.
Ownership History
Date
Name
Owned For
Owner Type
Purchase Details
Closed on
Jun 3, 2010
Sold by
Newby Verna K
Bought by
Newby Verna K and Verna K Powers Revocable Trust
Current Estimated Value
Home Financials for this Owner
Home Financials are based on the most recent Mortgage that was taken out on this home.
Original Mortgage
$41,000
Interest Rate
5.02%
Mortgage Type
New Conventional
Purchase Details
Closed on
Mar 14, 2008
Sold by
Powers Verna and Powers Verna K
Bought by
Powers Verna K and Verna K Powers Revocable Trust
Purchase Details
Closed on
Aug 27, 2003
Sold by
M D Merryfield Inc
Home Financials for this Owner
Home Financials are based on the most recent Mortgage that was taken out on this home.
Original Mortgage
$91,000
Outstanding Balance
$40,670
Interest Rate
5.71%
Estimated Equity
$248,735
Purchase Details
Closed on
Mar 4, 2003
Sold by
Manco Enterprises
Home Financials for this Owner
Home Financials are based on the most recent Mortgage that was taken out on this home.
Original Mortgage
$406,400
Interest Rate
5.71%
Create a Home Valuation Report for This Property
The Home Valuation Report is an in-depth analysis detailing your home's value as well as a comparison with similar homes in the area
Home Values in the Area
Average Home Value in this Area
Purchase History
| Date | Buyer | Sale Price | Title Company |
|---|---|---|---|
| Newby Verna K | -- | None Available | |
| Powers Verna K | -- | None Available | |
| -- | $125,500 | -- | |
| -- | $72,000 | -- |
Source: Public Records
Mortgage History
| Date | Status | Borrower | Loan Amount |
|---|---|---|---|
| Closed | Newby Verna K | $41,000 | |
| Open | -- | $91,000 | |
| Previous Owner | -- | $406,400 |
Source: Public Records
Tax History Compared to Growth
Tax History
| Year | Tax Paid | Tax Assessment Tax Assessment Total Assessment is a certain percentage of the fair market value that is determined by local assessors to be the total taxable value of land and additions on the property. | Land | Improvement |
|---|---|---|---|---|
| 2024 | $2,343 | $25,224 | $2,280 | $22,944 |
| 2023 | $2,343 | $24,489 | $2,280 | $22,209 |
| 2022 | $2,300 | $23,776 | $2,280 | $21,496 |
| 2021 | $2,239 | $23,084 | $2,280 | $20,804 |
| 2020 | $2,184 | $22,411 | $2,280 | $20,131 |
| 2019 | $2,137 | $21,951 | $2,280 | $19,671 |
| 2018 | $2,117 | $21,312 | $2,280 | $19,032 |
| 2017 | $2,116 | $21,534 | $2,280 | $19,254 |
| 2016 | $2,134 | $22,316 | $2,280 | $20,036 |
| 2015 | $2,010 | $21,035 | $2,280 | $18,755 |
| 2014 | $2,010 | $20,353 | $2,280 | $18,073 |
Source: Public Records
Map
Nearby Homes
- 601 N Chisholm Trail Way
- 912 N Barn Hill Way
- 608 N Remington Way
- 805 W Old Farm Way
- 0 N Czech Hall Rd
- 557 W Pine Rose Court Way
- 500 N Remington Way
- 534 W Pine Rose Court Way
- 304 N Geronimo Way
- 913 N Kirk Way
- 338 W Crooked Branch Way
- 531 W Shadow Ridge Way
- 413 W Pines Way
- 1408 N Golden Bell Way
- 1401 N Golden Bell Way
- 1250 N Tea Olive Way
- 5813 Tiger Stone Dr
- 11621 SW 58th St
- 5705 Tiger Stone Dr
- 0 N Mustang Rd
- 643 W Geronimo Way
- 635 W Geronimo Way
- 701 W Geronimo Way
- 803 N Cherokee Way
- 627 W Geronimo Court Way
- 627 W Geronimo Way
- 705 W Geronimo Way
- 712 N Chisholm Trail Way
- 801 N Chisholm Trail Way
- 713 N Cherokee Way
- 623 W Geronimo Way
- 708 N Chisholm Trail Way
- 713 N Chisholm Trail Way
- 709 N Cherokee Way
- 709 N Cherokee Way
- 709 N Chisholm Trail Way
- 619 W Geronimo Court Way
- 704 N Chisholm Trail Way
- 705 N Cherokee Way
- 712 N Geronimo Way