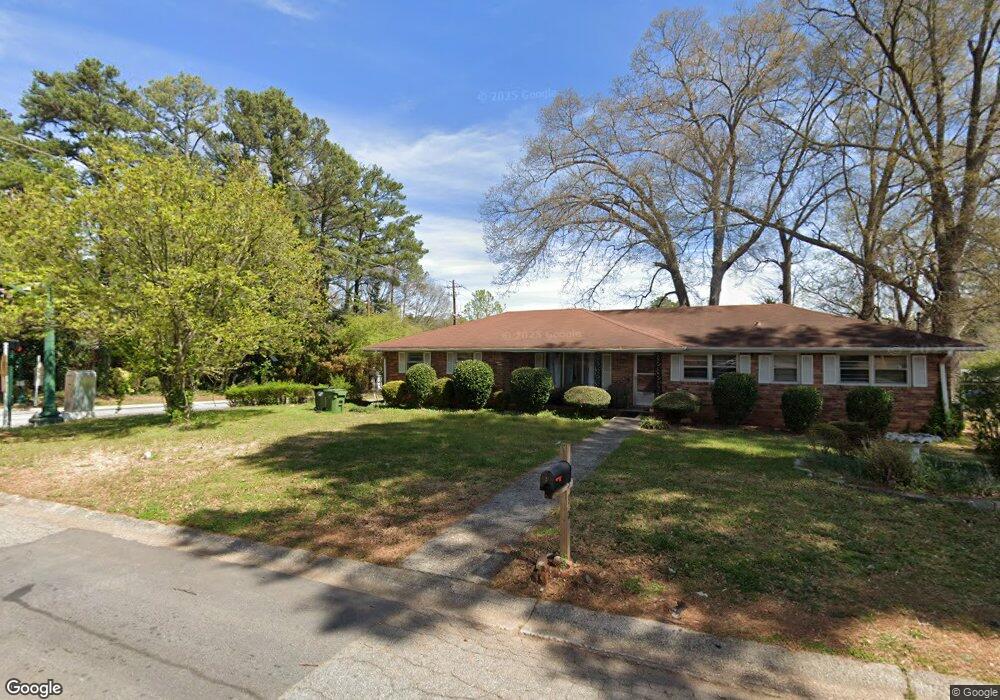
6390 Peacock Blvd Morrow, GA 30260
Estimated Value: $227,339 - $269,000
4
Beds
2
Baths
1,716
Sq Ft
$142/Sq Ft
Est. Value
About This Home
This home is located at 6390 Peacock Blvd, Morrow, GA 30260 and is currently estimated at $243,835, approximately $142 per square foot. 6390 Peacock Blvd is a home located in Clayton County with nearby schools including Morrow Elementary School, Morrow Middle School, and Morrow High School.
Ownership History
Date
Name
Owned For
Owner Type
Purchase Details
Closed on
Feb 10, 2017
Sold by
Garner Richard C
Bought by
Garner Richard C and Rainey Dorothy Ruth
Current Estimated Value
Purchase Details
Closed on
Feb 10, 2016
Sold by
Executor Wynn Victoria Ann
Bought by
Garner Richard C
Home Financials for this Owner
Home Financials are based on the most recent Mortgage that was taken out on this home.
Original Mortgage
$93,279
Interest Rate
4.5%
Mortgage Type
FHA
Purchase Details
Closed on
Oct 18, 2010
Sold by
Arnold Patsy A
Bought by
Arnold Patsy A
Purchase Details
Closed on
Aug 6, 1998
Sold by
Tucker Dorothy K and Tucker Williams
Bought by
Blakenship Rbt and Arnold Pats
Home Financials for this Owner
Home Financials are based on the most recent Mortgage that was taken out on this home.
Original Mortgage
$68,800
Interest Rate
6.97%
Mortgage Type
New Conventional
Create a Home Valuation Report for This Property
The Home Valuation Report is an in-depth analysis detailing your home's value as well as a comparison with similar homes in the area
Home Values in the Area
Average Home Value in this Area
Purchase History
| Date | Buyer | Sale Price | Title Company |
|---|---|---|---|
| Garner Richard C | -- | -- | |
| Garner Richard C | $95,000 | -- | |
| Arnold Patsy A | -- | -- | |
| Blakenship Rbt | $65,000 | -- |
Source: Public Records
Mortgage History
| Date | Status | Borrower | Loan Amount |
|---|---|---|---|
| Previous Owner | Garner Richard C | $93,279 | |
| Previous Owner | Blakenship Rbt | $68,800 |
Source: Public Records
Tax History
| Year | Tax Paid | Tax Assessment Tax Assessment Total Assessment is a certain percentage of the fair market value that is determined by local assessors to be the total taxable value of land and additions on the property. | Land | Improvement |
|---|---|---|---|---|
| 2025 | $3,002 | $94,680 | $8,000 | $86,680 |
| 2024 | $3,086 | $95,240 | $8,000 | $87,240 |
| 2023 | $3,426 | $86,800 | $8,000 | $78,800 |
| 2022 | $3,089 | $71,840 | $8,000 | $63,840 |
| 2021 | $2,447 | $55,840 | $8,000 | $47,840 |
| 2020 | $1,937 | $55,189 | $8,000 | $47,189 |
| 2019 | $1,962 | $55,128 | $6,400 | $48,728 |
| 2018 | $1,287 | $36,151 | $6,400 | $29,751 |
| 2017 | $1,138 | $31,882 | $6,400 | $25,482 |
| 2016 | $340 | $30,511 | $6,400 | $24,111 |
| 2015 | $179 | $0 | $0 | $0 |
| 2014 | $128 | $18,580 | $6,400 | $12,180 |
Source: Public Records
Map
Nearby Homes
- 1893 Stratford Arms Dr
- 2117 Amish Ct
- 1924 Mural Cir
- 6532 Debbie Sue Ln
- 2275 Santa fe St Unit 25
- 6541 Debbie Sue Ln
- 1804 Carla Dr
- 1802 Lake Harbin Rd
- 6495 Revena Dr
- 6186 Deans Way
- 6168 Deans Way
- 1931 Cornell Way
- 2144 Carriage Dr
- 6566 Melandre Dr
- 6633 Cameron Rd
- 1865 Oxford Dr
- 6359 Lanier Rd
- 6413 Maddox Rd
- 0 Carriage Dr Unit 10652198
- 0 Carriage Dr Unit 7688037
- 6390 Peacock Blvd Unit 1
- 6398 Peacock Blvd
- 6379 Heritage Run
- 6387 Heritage Run
- 6368 Harbin Woods Dr
- 6391 Peacock Blvd
- 6408 Peacock Blvd
- 6395 Heritage Run
- 6401 Peacock Blvd
- 6369 Harbin Woods Dr
- 6360 Harbin Woods Dr Unit 4
- 6361 Harbin Woods Dr
- 6409 Peacock Blvd
- 0 Lake Harbin Rd Unit 6674936
- 0 Lake Harbin Rd Unit 8729218
- S Lake Harbin Rd
- 0 Lake Harbin Rd Unit 8608819
- 6418 Peacock Blvd
- 6411 Heritage Run
- 2036 Heritage Place
Your Personal Tour Guide
Ask me questions while you tour the home.