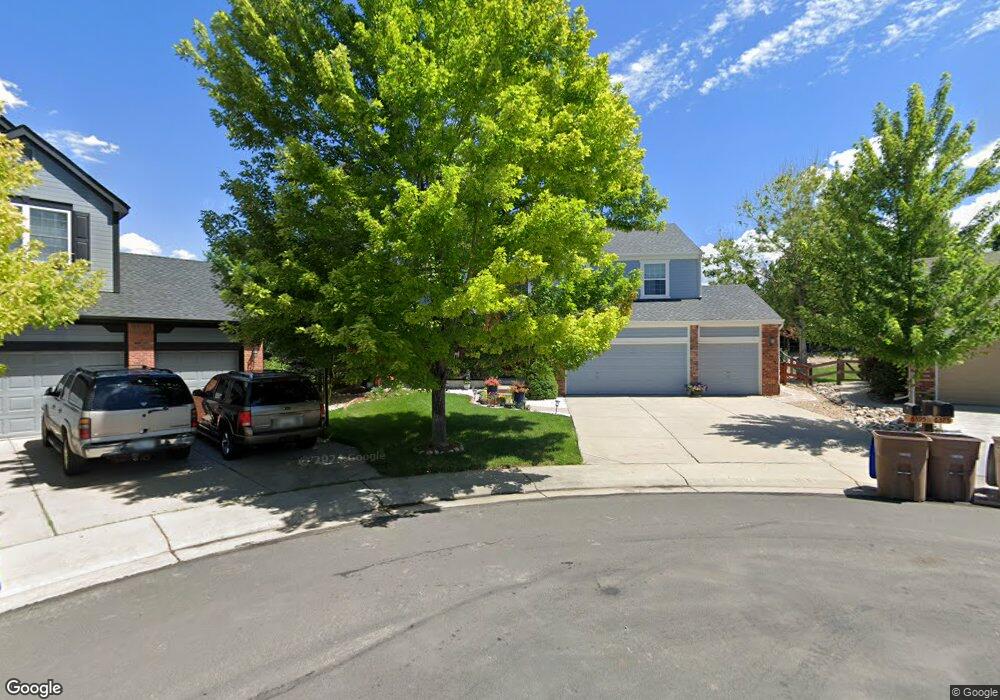
6395 S Walden Ln Aurora, CO 80016
The Farm-Arapahoe NeighborhoodEstimated Value: $730,146 - $750,000
5
Beds
3
Baths
4,125
Sq Ft
$180/Sq Ft
Est. Value
About This Home
This home is located at 6395 S Walden Ln, Aurora, CO 80016 and is currently estimated at $742,787, approximately $180 per square foot. 6395 S Walden Ln is a home located in Arapahoe County with nearby schools including Fox Hollow Elementary School, Liberty Middle School, and Grandview High School.
Ownership History
Date
Name
Owned For
Owner Type
Purchase Details
Closed on
Nov 4, 2019
Sold by
Lee Hyeyeong
Bought by
Nag Pinaki
Current Estimated Value
Home Financials for this Owner
Home Financials are based on the most recent Mortgage that was taken out on this home.
Original Mortgage
$465,300
Outstanding Balance
$406,674
Interest Rate
3.6%
Mortgage Type
New Conventional
Estimated Equity
$336,113
Purchase Details
Closed on
Jun 10, 2009
Sold by
Jung John J and Jung June T
Bought by
Lee Hyeyeong
Home Financials for this Owner
Home Financials are based on the most recent Mortgage that was taken out on this home.
Original Mortgage
$335,805
Interest Rate
4.7%
Mortgage Type
FHA
Purchase Details
Closed on
Mar 5, 2001
Sold by
Homes Of Co Lllp South Platte Company Llc N K
Bought by
Jung John J and Jung June T
Home Financials for this Owner
Home Financials are based on the most recent Mortgage that was taken out on this home.
Original Mortgage
$275,000
Interest Rate
7.19%
Create a Home Valuation Report for This Property
The Home Valuation Report is an in-depth analysis detailing your home's value as well as a comparison with similar homes in the area
Home Values in the Area
Average Home Value in this Area
Purchase History
| Date | Buyer | Sale Price | Title Company |
|---|---|---|---|
| Nag Pinaki | $495,000 | Land Title Guarantee Co | |
| Lee Hyeyeong | $342,000 | Security Title | |
| Jung John J | $348,162 | Land Title |
Source: Public Records
Mortgage History
| Date | Status | Borrower | Loan Amount |
|---|---|---|---|
| Open | Nag Pinaki | $465,300 | |
| Previous Owner | Lee Hyeyeong | $335,805 | |
| Previous Owner | Jung John J | $275,000 | |
| Closed | Jung John J | $38,345 |
Source: Public Records
Tax History
| Year | Tax Paid | Tax Assessment Tax Assessment Total Assessment is a certain percentage of the fair market value that is determined by local assessors to be the total taxable value of land and additions on the property. | Land | Improvement |
|---|---|---|---|---|
| 2025 | $5,744 | $43,463 | -- | -- |
| 2024 | $5,185 | $47,851 | -- | -- |
| 2023 | $5,185 | $47,851 | $0 | $0 |
| 2022 | $4,120 | $35,452 | $0 | $0 |
| 2021 | $4,149 | $35,452 | $0 | $0 |
| 2020 | $4,430 | $38,060 | $0 | $0 |
| 2019 | $4,413 | $38,060 | $0 | $0 |
| 2018 | $3,702 | $30,420 | $0 | $0 |
| 2017 | $3,645 | $30,420 | $0 | $0 |
| 2016 | $3,825 | $28,998 | $0 | $0 |
| 2015 | $3,688 | $28,998 | $0 | $0 |
| 2014 | $3,752 | $26,809 | $0 | $0 |
| 2013 | -- | $27,030 | $0 | $0 |
Source: Public Records
Map
Nearby Homes
- 6368 S Walden Way
- 6535 S Waco Ct
- 18119 E Caley Cir
- 6540 S Uravan Ct
- 6412 S Sedalia St
- 6598 S Telluride St
- 17757 E Lake Place
- 19221 E Maplewood Place
- 6141 S Richfield Ct
- 6373 S Richfield St
- 18917 E Low Cir
- 19052 E Briarwood Dr
- 19098 E Ida Dr
- 5776 S Truckee Ct
- 5772 S Truckee St
- 16866 E Peakview Ave
- 17732 E Ida Ave
- 18060 E Dorado Ave
- 5886 S Ensenada St
- 5863 S Danube St
- 6375 S Walden Ln
- 6376 S Walden Ln
- 6409 S Walden Way
- 6397 S Walden Way
- 6387 S Walden Way
- 6356 S Walden Ln
- 18249 E Weaver Place
- 18239 E Weaver Place
- 6355 S Walden Ln
- 6377 S Walden Way
- 6367 S Walden Way
- 6336 S Walden Ln
- 18235 E Weaver Place
- 6335 S Walden Ln
- 6357 S Walden Way
- 6337 S Walden Way
- 18229 E Weaver Place
- 18236 E Caley Dr
- 6315 S Walden Ln
- 6317 S Walden Way
Your Personal Tour Guide
Ask me questions while you tour the home.