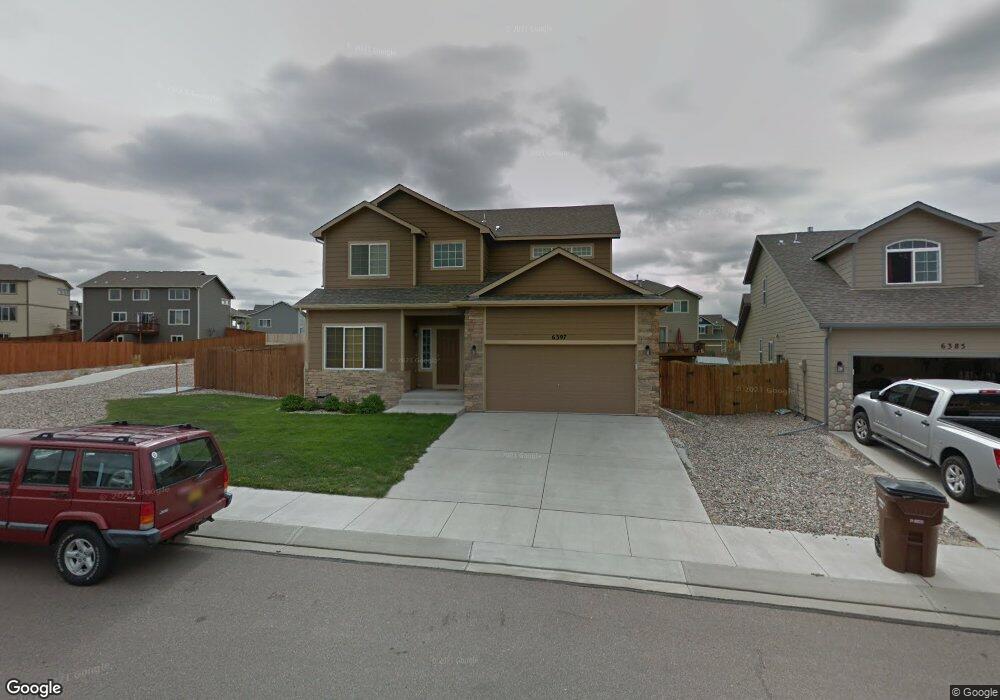
6397 Dancing Moon Way Colorado Springs, CO 80911
Fountain Valley Ranch NeighborhoodEstimated Value: $459,000 - $488,000
4
Beds
2
Baths
2,770
Sq Ft
$169/Sq Ft
Est. Value
About This Home
This home is located at 6397 Dancing Moon Way, Colorado Springs, CO 80911 and is currently estimated at $468,512, approximately $169 per square foot. 6397 Dancing Moon Way is a home located in El Paso County with nearby schools including French Elementary School, Sproul Junior High School, and Widefield High School.
Ownership History
Date
Name
Owned For
Owner Type
Purchase Details
Closed on
Oct 29, 2018
Sold by
Harris Elizabeth T and Harris John
Bought by
Stefancic Ginny Marie and Clemens Kyle M
Current Estimated Value
Home Financials for this Owner
Home Financials are based on the most recent Mortgage that was taken out on this home.
Original Mortgage
$286,150
Outstanding Balance
$250,577
Interest Rate
4.6%
Mortgage Type
New Conventional
Estimated Equity
$217,935
Purchase Details
Closed on
Jan 30, 2015
Sold by
Harris Elizabeth T
Bought by
Harris Elizabeth T and Harris John
Home Financials for this Owner
Home Financials are based on the most recent Mortgage that was taken out on this home.
Original Mortgage
$233,348
Interest Rate
3.83%
Mortgage Type
VA
Purchase Details
Closed on
Oct 29, 2012
Sold by
Journey Homes Cs Llc
Bought by
Hughes Jerron L
Home Financials for this Owner
Home Financials are based on the most recent Mortgage that was taken out on this home.
Original Mortgage
$233,995
Interest Rate
3.52%
Mortgage Type
VA
Create a Home Valuation Report for This Property
The Home Valuation Report is an in-depth analysis detailing your home's value as well as a comparison with similar homes in the area
Home Values in the Area
Average Home Value in this Area
Purchase History
| Date | Buyer | Sale Price | Title Company |
|---|---|---|---|
| Stefancic Ginny Marie | $295,000 | Empire Title Co Ltd | |
| Harris Elizabeth T | -- | None Available | |
| Harris Elizabeth T | $242,000 | None Available | |
| Hughes Jerron L | $229,070 | Heritage Title |
Source: Public Records
Mortgage History
| Date | Status | Borrower | Loan Amount |
|---|---|---|---|
| Open | Stefancic Ginny Marie | $286,150 | |
| Previous Owner | Harris Elizabeth T | $233,348 | |
| Previous Owner | Hughes Jerron L | $233,995 |
Source: Public Records
Tax History Compared to Growth
Tax History
| Year | Tax Paid | Tax Assessment Tax Assessment Total Assessment is a certain percentage of the fair market value that is determined by local assessors to be the total taxable value of land and additions on the property. | Land | Improvement |
|---|---|---|---|---|
| 2025 | $3,242 | $30,930 | -- | -- |
| 2024 | $3,196 | $32,000 | $5,470 | $26,530 |
| 2023 | $3,196 | $32,000 | $5,470 | $26,530 |
| 2022 | $2,696 | $23,510 | $4,050 | $19,460 |
| 2021 | $2,861 | $24,190 | $4,170 | $20,020 |
| 2020 | $2,573 | $21,340 | $3,650 | $17,690 |
| 2019 | $2,563 | $21,340 | $3,650 | $17,690 |
| 2018 | $2,279 | $18,110 | $3,670 | $14,440 |
| 2017 | $2,369 | $18,110 | $3,670 | $14,440 |
| 2016 | $2,007 | $18,070 | $3,820 | $14,250 |
| 2015 | $2,039 | $18,070 | $3,820 | $14,250 |
| 2014 | $2,035 | $18,070 | $2,560 | $15,510 |
Source: Public Records
Map
Nearby Homes
- 6446 Dancing Moon Way
- 6053 San Mateo Dr
- 6531 Passing Sky Dr
- 4637 Dancing Light Way
- 4530 Sierra Rica Rd
- 5963 Dancing Sun Way
- 4651 Dancing Rain Way
- 6340 Passing Sky Dr
- 4916 Justeagen Dr
- 6425 Dancing Star Way
- 4819 Justeagen Dr
- 4966 Spokane Way
- 4945 Gami Way
- 4959 Gami Way
- 4858 Wolf Moon Dr
- 6427 Marilee Way
- 4887 Wolf Moon Dr
- 4953 Escanaba Dr
- 6311 San Mateo Dr
- 7000 Passing Sky Dr
- 6385 Dancing Moon Way
- 6373 Dancing Moon Way
- 4612 Whirling Oak Way
- 6053 Santo Domingo Rd
- 4622 Whirling Oak Way
- 6409 Dancing Moon Way
- 4602 Whirling Oak Way
- 6361 Dancing Moon Way
- 4552 Whirling Oak Way
- 4632 Whirling Oak Way
- 6422 Dancing Moon Way
- 6045 Santo Domingo Rd
- 4642 Whirling Oak Way
- 6421 Dancing Moon Way
- 6037 Santo Domingo Rd
- 4542 Whirling Oak Way
- 4652 Whirling Oak Way
- 6350 Dancing Moon Way
- 6434 Dancing Moon Way
- 6433 Dancing Moon Way