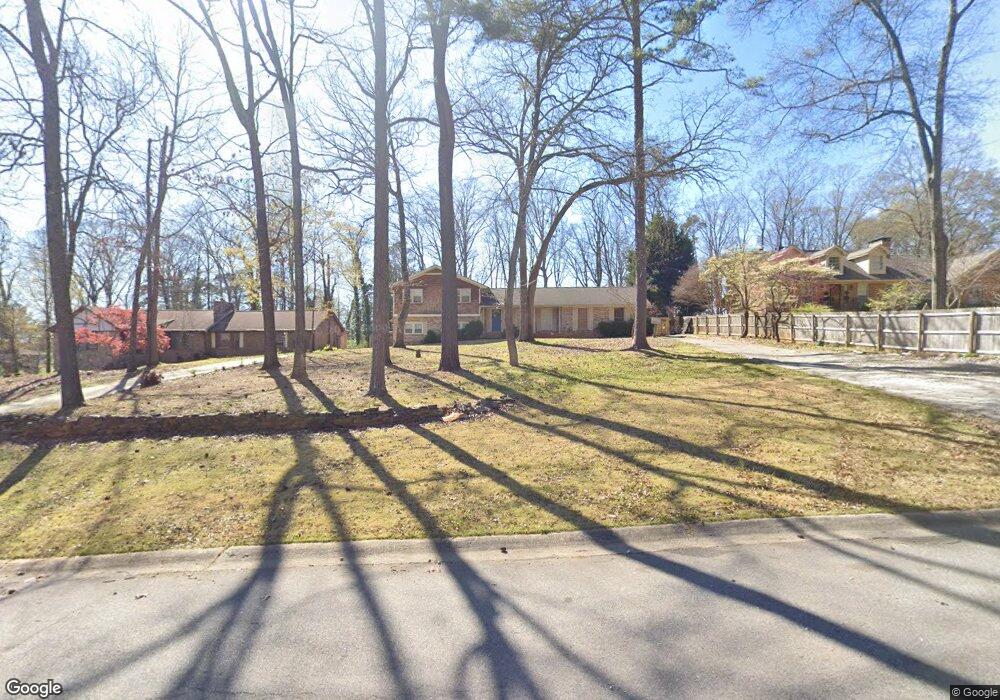
6397 Priscilla Ct Morrow, GA 30260
Estimated Value: $235,851 - $301,000
3
Beds
3
Baths
1,968
Sq Ft
$139/Sq Ft
Est. Value
About This Home
This home is located at 6397 Priscilla Ct, Morrow, GA 30260 and is currently estimated at $272,713, approximately $138 per square foot. 6397 Priscilla Ct is a home located in Clayton County with nearby schools including William M. Mcgarrah Elementary School, Rex Mill Middle School, and Mount Zion High School.
Ownership History
Date
Name
Owned For
Owner Type
Purchase Details
Closed on
Dec 12, 2023
Sold by
Neville Antonio D
Bought by
Neville Family Trust and Neville Antonio D
Current Estimated Value
Purchase Details
Closed on
Jan 17, 2020
Sold by
Neville Antonio D
Bought by
Tinch Keyanna L
Purchase Details
Closed on
Apr 28, 2006
Sold by
Lavender Thomas D and Lavender Patricia
Bought by
Meville Antonio D and Meville Kaysha K
Home Financials for this Owner
Home Financials are based on the most recent Mortgage that was taken out on this home.
Original Mortgage
$168,750
Interest Rate
8.73%
Mortgage Type
New Conventional
Purchase Details
Closed on
May 31, 2001
Sold by
Young George R
Bought by
Lavender Thomas D and Lavender Patricia
Home Financials for this Owner
Home Financials are based on the most recent Mortgage that was taken out on this home.
Original Mortgage
$100,000
Interest Rate
7.05%
Mortgage Type
New Conventional
Create a Home Valuation Report for This Property
The Home Valuation Report is an in-depth analysis detailing your home's value as well as a comparison with similar homes in the area
Home Values in the Area
Average Home Value in this Area
Purchase History
| Date | Buyer | Sale Price | Title Company |
|---|---|---|---|
| Neville Family Trust | -- | -- | |
| Tinch Keyanna L | -- | -- | |
| Meville Antonio D | $168,800 | -- | |
| Lavender Thomas D | $149,900 | -- |
Source: Public Records
Mortgage History
| Date | Status | Borrower | Loan Amount |
|---|---|---|---|
| Previous Owner | Meville Antonio D | $168,750 | |
| Previous Owner | Lavender Thomas D | $100,000 |
Source: Public Records
Tax History Compared to Growth
Tax History
| Year | Tax Paid | Tax Assessment Tax Assessment Total Assessment is a certain percentage of the fair market value that is determined by local assessors to be the total taxable value of land and additions on the property. | Land | Improvement |
|---|---|---|---|---|
| 2024 | $3,217 | $81,560 | $8,400 | $73,160 |
| 2023 | $1,803 | $76,960 | $8,400 | $68,560 |
| 2022 | $2,247 | $66,360 | $8,400 | $57,960 |
| 2021 | $1,586 | $49,280 | $8,400 | $40,880 |
| 2020 | $1,939 | $47,617 | $10,000 | $37,617 |
| 2019 | $1,333 | $42,842 | $10,000 | $32,842 |
| 2018 | $1,289 | $41,740 | $10,000 | $31,740 |
| 2017 | $1,151 | $38,293 | $10,000 | $28,293 |
| 2016 | $1,255 | $40,852 | $10,000 | $30,852 |
| 2015 | $1,249 | $0 | $0 | $0 |
| 2014 | $1,264 | $41,759 | $10,000 | $31,759 |
Source: Public Records
Map
Nearby Homes
- 6409 Priscilla Ct
- 6385 Priscilla Ct
- 6421 Priscilla Ct
- 0 Priscilla Ct Unit 2982358
- 6373 Priscilla Ct
- 6398 Fairlane Dr
- 6390 Fairlane Dr
- 6406 Fairlane Dr
- 6382 Fairlane Dr
- 6414 Fairlane Dr
- 6408 Priscilla Ct
- 2800 Priscilla Way
- 2786 Priscilla Way
- 6420 Priscilla Ct
- 2810 Priscilla Way
- 6374 Fairlane Dr
- 6396 Priscilla Ct
- 6422 Fairlane Dr
- 6386 Priscilla Ct
- 0 Fairlane Dr Unit 8441830