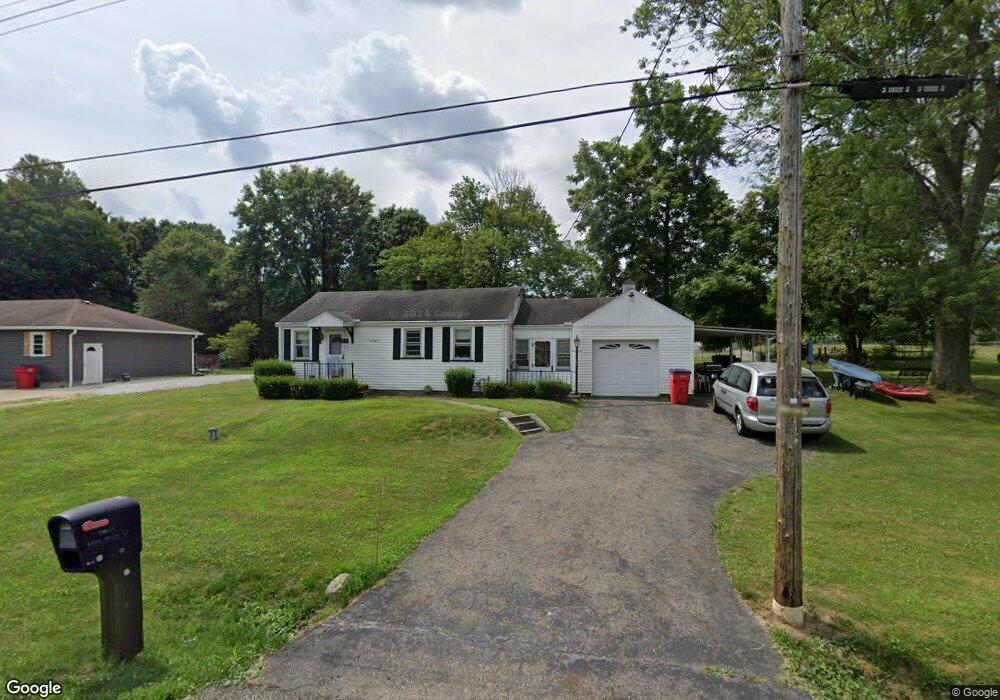
6398 Plum St Louisville, OH 44641
Estimated Value: $150,893 - $191,000
2
Beds
1
Bath
792
Sq Ft
$216/Sq Ft
Est. Value
About This Home
This home is located at 6398 Plum St, Louisville, OH 44641 and is currently estimated at $171,223, approximately $216 per square foot. 6398 Plum St is a home located in Stark County with nearby schools including Louisville High School, East Branch Preparatory Academy Wright Preparatory Academy, and Canton Harbor High School.
Ownership History
Date
Name
Owned For
Owner Type
Purchase Details
Closed on
Jan 24, 2018
Sold by
Twiss James A and Twiss Diana B
Bought by
Twiss James A and Twiss Diana B
Current Estimated Value
Home Financials for this Owner
Home Financials are based on the most recent Mortgage that was taken out on this home.
Original Mortgage
$40,000
Outstanding Balance
$22,489
Interest Rate
3.94%
Mortgage Type
New Conventional
Estimated Equity
$148,734
Purchase Details
Closed on
Sep 26, 2016
Sold by
Twiss Thomas
Bought by
Twiss James A
Purchase Details
Closed on
Aug 15, 2015
Sold by
Twiss James A
Bought by
Twiss Thomas and Twiss Family Irrevocable Trust
Purchase Details
Closed on
Nov 10, 2003
Sold by
Twiss James A and Twiss Ruth Anne
Bought by
Mogus John E and Mogus Katrina D
Home Financials for this Owner
Home Financials are based on the most recent Mortgage that was taken out on this home.
Original Mortgage
$29,745
Interest Rate
5.81%
Mortgage Type
Purchase Money Mortgage
Create a Home Valuation Report for This Property
The Home Valuation Report is an in-depth analysis detailing your home's value as well as a comparison with similar homes in the area
Home Values in the Area
Average Home Value in this Area
Purchase History
| Date | Buyer | Sale Price | Title Company |
|---|---|---|---|
| Twiss James A | -- | Timios Inc | |
| Twiss James A | -- | None Available | |
| Twiss Thomas | -- | Attorney | |
| Mogus John E | $35,000 | -- |
Source: Public Records
Mortgage History
| Date | Status | Borrower | Loan Amount |
|---|---|---|---|
| Open | Twiss James A | $40,000 | |
| Previous Owner | Mogus John E | $29,745 |
Source: Public Records
Tax History Compared to Growth
Tax History
| Year | Tax Paid | Tax Assessment Tax Assessment Total Assessment is a certain percentage of the fair market value that is determined by local assessors to be the total taxable value of land and additions on the property. | Land | Improvement |
|---|---|---|---|---|
| 2025 | -- | $43,510 | $16,700 | $26,810 |
| 2024 | -- | $43,510 | $16,700 | $26,810 |
| 2023 | $1,619 | $32,520 | $13,550 | $18,970 |
| 2022 | $1,625 | $32,520 | $13,550 | $18,970 |
| 2021 | $1,629 | $32,520 | $13,550 | $18,970 |
| 2020 | $1,358 | $28,560 | $12,180 | $16,380 |
| 2019 | $1,365 | $28,560 | $12,180 | $16,380 |
| 2018 | $1,361 | $28,560 | $12,180 | $16,380 |
| 2017 | $1,213 | $24,300 | $9,140 | $15,160 |
| 2016 | $1,188 | $24,300 | $9,140 | $15,160 |
| 2015 | $743 | $24,300 | $9,140 | $15,160 |
| 2014 | $715 | $22,580 | $8,470 | $14,110 |
| 2013 | $361 | $22,580 | $8,470 | $14,110 |
Source: Public Records
Map
Nearby Homes
- 6083 Apple St
- 248 Menegay Rd
- 201 Indiana Ave
- 414 Honeycrisp Dr NE
- 1149 Sturbridge Dr
- 1175 Sturbridge Dr
- 4060 Hambleton Ave NE
- Forsythia Plan at Orchard Park - Aspire Single Family Collection
- Goldenrod Plan at Orchard Park - Aspire Single Family Collection
- Water Lily Plan at Orchard Park - Aspire Single Family Collection
- Oleander Plan at Orchard Park - Aspire Single Family Collection
- Beckfield Plan at Orchard Park - Aspire Townhome Collection
- 2975 Mcintosh Dr NE
- 2981 Mcintosh Dr NE
- 2980 Mcintosh Dr NE
- 424 Honeycrisp Dr NE
- 2969 Mcintosh Dr NE
- 2974 Mcintosh Dr NE
- 420 Honeycrisp Dr NE
- 1561 Noel St
- 6410 Plum St
- 6377 Plum St
- 6405 Plum St
- 4770 Fruitland Ave
- 6434 Plum St
- 6450 Plum St
- 6399 Apple St
- 4750 Fruitland Ave
- 6445 Plum St
- 4800 Fruitland Ave
- 6375 Apple St
- 4795 Fruitland Ave
- 4838 Fruitland Ave
- 4815 Fruitland Ave
- 4721 Fruitland Ave
- 0 Fruitland Ave NE Unit 4355904
- 6306 Plum St
- 6353 Apple St
- 4833 Fruitland Ave
- 6455 Apple St