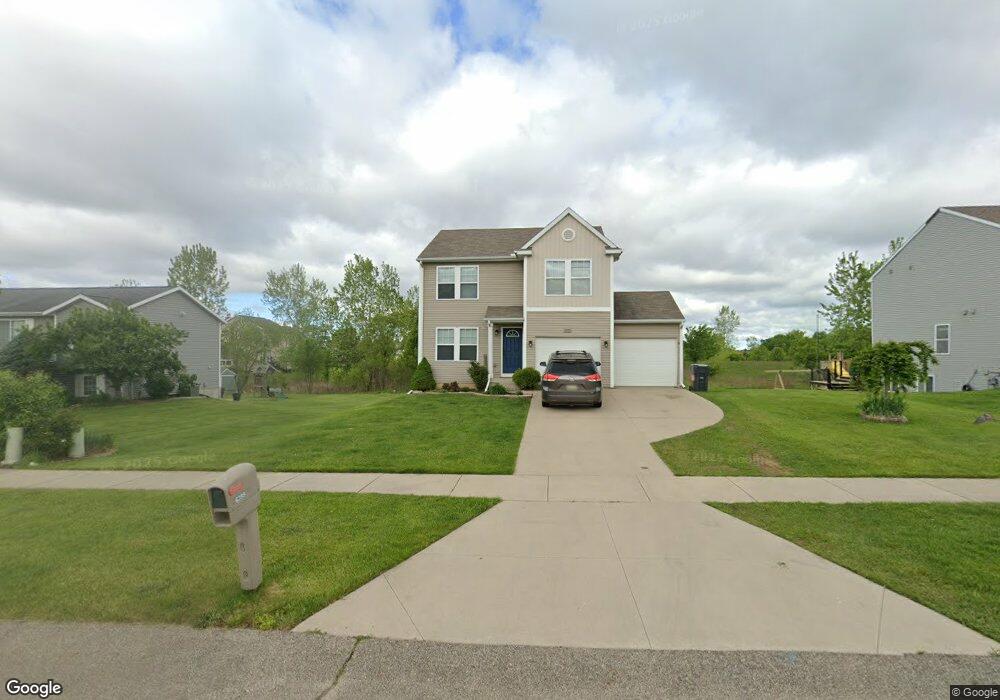
6399 Dew Point Ct SE Caledonia, MI 49316
Estimated Value: $385,000 - $429,000
3
Beds
4
Baths
1,506
Sq Ft
$271/Sq Ft
Est. Value
About This Home
This home is located at 6399 Dew Point Ct SE, Caledonia, MI 49316 and is currently estimated at $408,067, approximately $270 per square foot. 6399 Dew Point Ct SE is a home located in Kent County with nearby schools including Explorer Elementary School, Pinewood Middle School, and East Kentwood High School.
Ownership History
Date
Name
Owned For
Owner Type
Purchase Details
Closed on
Oct 10, 2023
Sold by
Caldwell-Jackson Melissa
Bought by
Thein Saw Hse-Poe and Htoo Naw Ben
Current Estimated Value
Home Financials for this Owner
Home Financials are based on the most recent Mortgage that was taken out on this home.
Original Mortgage
$346,750
Outstanding Balance
$339,763
Interest Rate
6.99%
Mortgage Type
New Conventional
Estimated Equity
$68,304
Purchase Details
Closed on
Aug 18, 2009
Sold by
Cbk Development Llc
Bought by
Caldwell Jackson Melissa
Home Financials for this Owner
Home Financials are based on the most recent Mortgage that was taken out on this home.
Original Mortgage
$35,137
Interest Rate
5.27%
Mortgage Type
Construction
Purchase Details
Closed on
Jul 17, 2008
Sold by
Vw Development Co
Bought by
Cbk Development Llc
Create a Home Valuation Report for This Property
The Home Valuation Report is an in-depth analysis detailing your home's value as well as a comparison with similar homes in the area
Home Values in the Area
Average Home Value in this Area
Purchase History
| Date | Buyer | Sale Price | Title Company |
|---|---|---|---|
| Thein Saw Hse-Poe | $365,000 | Chicago Title | |
| Caldwell Jackson Melissa | $40,000 | None Available | |
| Cbk Development Llc | $175,000 | None Available |
Source: Public Records
Mortgage History
| Date | Status | Borrower | Loan Amount |
|---|---|---|---|
| Open | Thein Saw Hse-Poe | $346,750 | |
| Previous Owner | Caldwell Jackson Melissa | $35,137 |
Source: Public Records
Tax History Compared to Growth
Tax History
| Year | Tax Paid | Tax Assessment Tax Assessment Total Assessment is a certain percentage of the fair market value that is determined by local assessors to be the total taxable value of land and additions on the property. | Land | Improvement |
|---|---|---|---|---|
| 2025 | $2,661 | $177,400 | $0 | $0 |
| 2024 | $1,809 | $156,800 | $0 | $0 |
| 2023 | $1,809 | $131,600 | $0 | $0 |
| 2022 | $1,809 | $118,700 | $0 | $0 |
| 2021 | $2,469 | $108,800 | $0 | $0 |
| 2020 | $1,761 | $105,100 | $0 | $0 |
| 2019 | $2,299 | $94,300 | $0 | $0 |
| 2018 | $2,299 | $95,500 | $20,000 | $75,500 |
| 2017 | $0 | $84,100 | $0 | $0 |
| 2016 | $0 | $77,800 | $0 | $0 |
| 2015 | -- | $77,800 | $0 | $0 |
| 2013 | -- | $70,700 | $0 | $0 |
Source: Public Records
Map
Nearby Homes
- 6495 Avalon Dr SE
- 2818 Bridgeside Dr SE
- 2274 Vantage Ct SE
- 6688 Passons Ct SE Unit 16
- 6751 Vantage Dr SE
- 6525 Leisure Creek Dr SE
- 5920 Castle Brook Ave SE
- 2772 60th St SE
- 6865 Deer Cove Dr SE
- 6673 Leisure Creek Dr SE
- 6785 Summerbreeze Dr SE
- 6903 Hartman Dr SE
- 2496 Promise Dr SE
- 2683 Hawk Ridge Ct
- Integrity 2000 Plan at Bretonfield Preserve
- Integrity 2280 Plan at Bretonfield Preserve
- Integrity 2085 Plan at Bretonfield Preserve
- Integrity 1910 Plan at Bretonfield Preserve
- Integrity 1530 Plan at Bretonfield Preserve
- Elements 2090 Plan at Bretonfield Preserve
- 6399 Dew Pointe Ave SE
- 6395 Dew Pointe Ave SE
- 6395 Dew Point Ct SE
- 6403 Dew Pointe Ave SE
- 6403 Dew Point Ct SE
- 6391 Dew Pointe Ave SE
- 6391 Dew Point Ct SE
- 6402 Dew Point Ct SE
- 6451 Prairie Pointe Dr SE
- 6394 Dew Point Ct SE
- 6386 Dew Pointe Ave SE
- 6439 Prairie Pointe Dr SE
- 6394 Dew Pointe Ave SE
- 6414 Dew Point Ct SE
- 6386 Dew Point Ct SE
- 6463 Prairie Pointe Dr SE
- 6387 Stoney Point Dr SE
- 6437 Dew Pointe Ave SE
- 6383 Stoney Point Dr SE
- 6428 Dew Point Ct SE