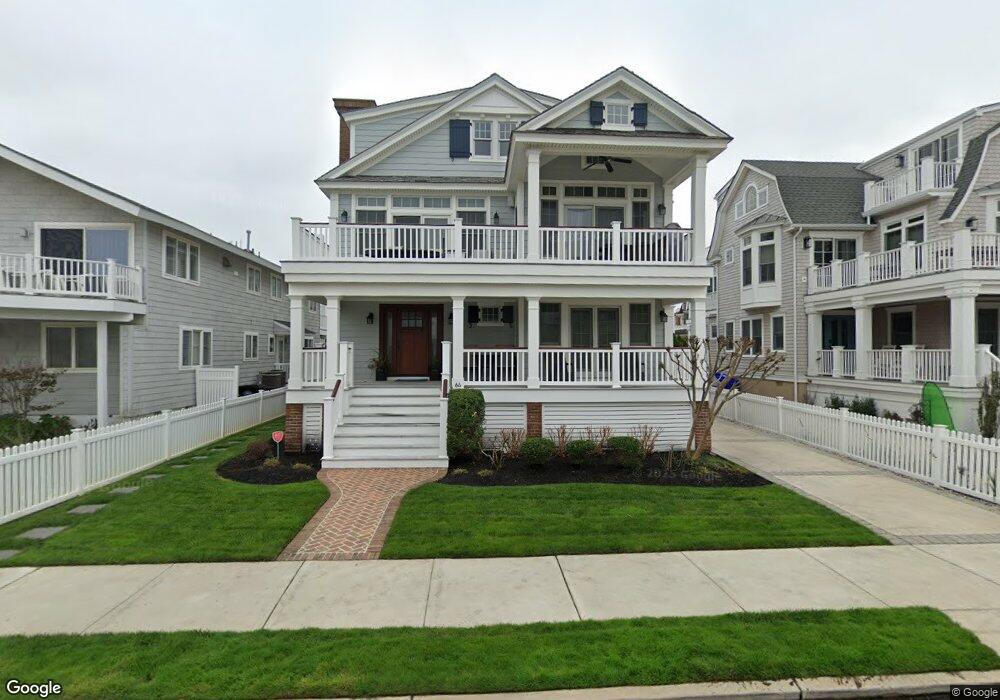
64 14th St E Avalon, NJ 08202
Estimated Value: $4,970,000 - $5,937,000
Studio
--
Bath
3,691
Sq Ft
$1,434/Sq Ft
Est. Value
About This Home
This home is located at 64 14th St E, Avalon, NJ 08202 and is currently estimated at $5,293,268, approximately $1,434 per square foot. 64 14th St E is a home located in Cape May County with nearby schools including Avalon Elementary School.
Ownership History
Date
Name
Owned For
Owner Type
Purchase Details
Closed on
Feb 24, 2025
Sold by
Jones Jeffrey J
Bought by
Deed Of Trust and Jones
Current Estimated Value
Purchase Details
Closed on
Sep 15, 2011
Sold by
Smith Rebecca L and Roehrs Geoffrey C
Bought by
Jones Jeffrey J
Home Financials for this Owner
Home Financials are based on the most recent Mortgage that was taken out on this home.
Original Mortgage
$750,000
Interest Rate
3.37%
Mortgage Type
New Conventional
Purchase Details
Closed on
Jan 21, 1991
Sold by
Roehers Brent W
Bought by
Smith Rebecca L Et Als
Create a Home Valuation Report for This Property
The Home Valuation Report is an in-depth analysis detailing your home's value as well as a comparison with similar homes in the area
Home Values in the Area
Average Home Value in this Area
Purchase History
| Date | Buyer | Sale Price | Title Company |
|---|---|---|---|
| Deed Of Trust | -- | None Listed On Document | |
| Jones Jeffrey J | $1,575,000 | Multiple | |
| Smith Rebecca L Et Als | -- | -- |
Source: Public Records
Mortgage History
| Date | Status | Borrower | Loan Amount |
|---|---|---|---|
| Previous Owner | Jones Jeffrey J | $750,000 |
Source: Public Records
Tax History
| Year | Tax Paid | Tax Assessment Tax Assessment Total Assessment is a certain percentage of the fair market value that is determined by local assessors to be the total taxable value of land and additions on the property. | Land | Improvement |
|---|---|---|---|---|
| 2025 | $17,512 | $2,852,100 | $2,000,000 | $852,100 |
| 2024 | $17,512 | $2,852,100 | $2,000,000 | $852,100 |
| 2023 | $17,369 | $2,852,100 | $2,000,000 | $852,100 |
| 2022 | $16,200 | $2,852,100 | $2,000,000 | $852,100 |
| 2021 | $15,601 | $2,852,100 | $2,000,000 | $852,100 |
| 2020 | $15,002 | $2,852,100 | $2,000,000 | $852,100 |
| 2019 | $14,546 | $2,852,100 | $2,000,000 | $852,100 |
| 2018 | $13,918 | $2,852,100 | $2,000,000 | $852,100 |
| 2017 | $13,058 | $2,348,500 | $1,600,000 | $748,500 |
| 2016 | $12,917 | $2,348,500 | $1,600,000 | $748,500 |
| 2015 | $12,705 | $2,348,500 | $1,600,000 | $748,500 |
| 2014 | $12,564 | $2,348,500 | $1,600,000 | $748,500 |
Source: Public Records
Map
Nearby Homes
Your Personal Tour Guide
Ask me questions while you tour the home.