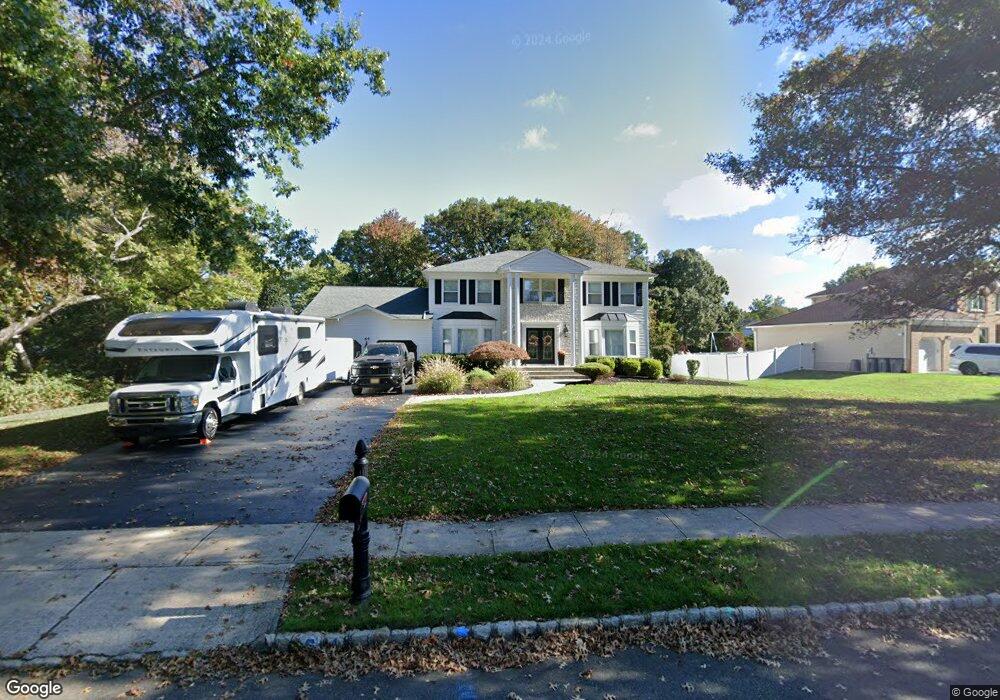
64 Apache Dr Manalapan, NJ 07726
Estimated Value: $1,044,000 - $1,112,000
4
Beds
3
Baths
3,089
Sq Ft
$348/Sq Ft
Est. Value
About This Home
This home is located at 64 Apache Dr, Manalapan, NJ 07726 and is currently estimated at $1,073,629, approximately $347 per square foot. 64 Apache Dr is a home located in Monmouth County with nearby schools including Clark Mills Elementary School, Pine Brook Elementary School, and Manalapan-Englishtown Middle School.
Ownership History
Date
Name
Owned For
Owner Type
Purchase Details
Closed on
Oct 13, 2020
Sold by
Walent Robert A and Walent Karen L
Bought by
Steenweg Matthew and Steenweg Jennifer
Current Estimated Value
Home Financials for this Owner
Home Financials are based on the most recent Mortgage that was taken out on this home.
Original Mortgage
$541,998
Outstanding Balance
$481,200
Interest Rate
2.8%
Mortgage Type
New Conventional
Estimated Equity
$592,429
Purchase Details
Closed on
Aug 25, 1997
Sold by
Krompier Douglas
Bought by
Walent Robert and Walent Karen
Home Financials for this Owner
Home Financials are based on the most recent Mortgage that was taken out on this home.
Original Mortgage
$135,000
Interest Rate
7.36%
Create a Home Valuation Report for This Property
The Home Valuation Report is an in-depth analysis detailing your home's value as well as a comparison with similar homes in the area
Home Values in the Area
Average Home Value in this Area
Purchase History
| Date | Buyer | Sale Price | Title Company |
|---|---|---|---|
| Steenweg Matthew | $650,000 | Coastal Title Agency | |
| Walent Robert | $331,500 | -- |
Source: Public Records
Mortgage History
| Date | Status | Borrower | Loan Amount |
|---|---|---|---|
| Open | Steenweg Matthew | $541,998 | |
| Previous Owner | Walent Robert | $135,000 |
Source: Public Records
Tax History Compared to Growth
Tax History
| Year | Tax Paid | Tax Assessment Tax Assessment Total Assessment is a certain percentage of the fair market value that is determined by local assessors to be the total taxable value of land and additions on the property. | Land | Improvement |
|---|---|---|---|---|
| 2025 | $15,914 | $1,025,100 | $381,000 | $644,100 |
| 2024 | $13,675 | $942,800 | $381,000 | $561,800 |
| 2023 | $13,675 | $821,800 | $336,000 | $485,800 |
| 2022 | $12,238 | $723,900 | $261,300 | $462,600 |
| 2021 | $12,238 | $589,900 | $178,500 | $411,400 |
| 2020 | $11,971 | $583,100 | $174,000 | $409,100 |
| 2019 | $12,293 | $598,200 | $201,000 | $397,200 |
| 2018 | $11,333 | $548,300 | $169,500 | $378,800 |
| 2017 | $11,462 | $554,800 | $160,500 | $394,300 |
| 2016 | $10,857 | $531,700 | $142,500 | $389,200 |
| 2015 | $10,582 | $512,700 | $133,500 | $379,200 |
| 2014 | $10,714 | $505,400 | $156,000 | $349,400 |
Source: Public Records
Map
Nearby Homes
- 224 Union Hill Rd
- 96 Sofia Dr
- 12 Tori Ln
- 6 Scarlett Terrace
- 6 Blackfoot Dr
- 9 Joyce Ct
- 210 Pine Brook Rd
- 32 Tarrytown Rd
- 8 Chesapeake Rd
- 56 Tarrytown Rd
- 11 Oxford Rd
- 33 Denise Ct
- 89 Old Queens Blvd
- 1 Spruce Way
- 160 Pension Rd
- 4 Spruce Way
- 1 Richard Ct
- 3 Cedar Ct
- 23 Pension Hill Rd
- 21 Pension Hill Rd Unit 1