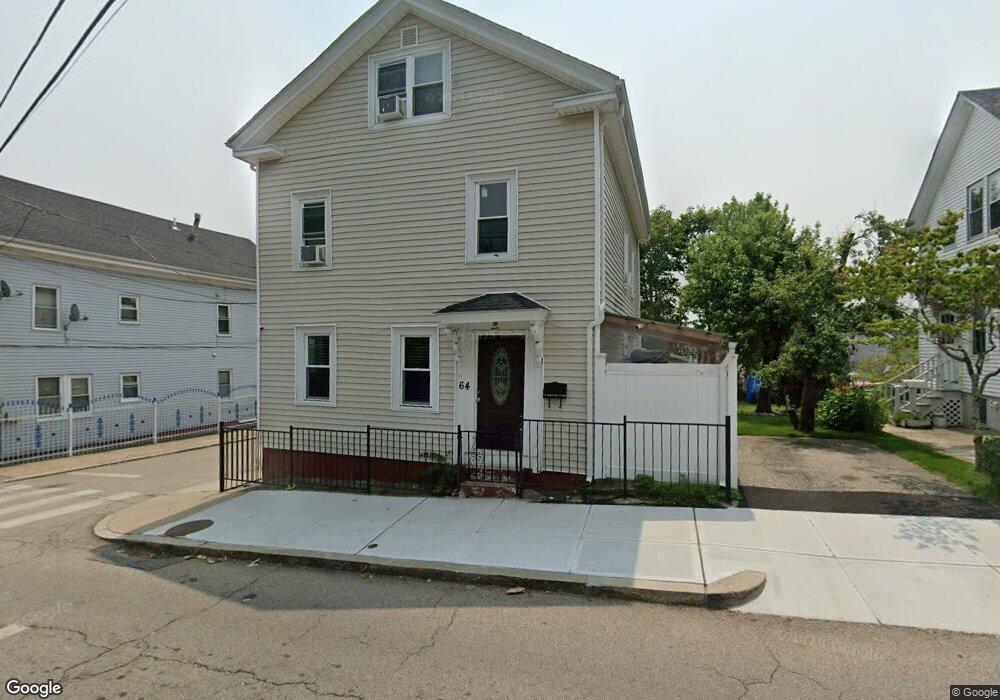
64 Appleton St Providence, RI 02909
Olneyville NeighborhoodEstimated Value: $388,953 - $476,000
4
Beds
2
Baths
1,690
Sq Ft
$251/Sq Ft
Est. Value
About This Home
This home is located at 64 Appleton St, Providence, RI 02909 and is currently estimated at $423,988, approximately $250 per square foot. 64 Appleton St is a home located in Providence County with nearby schools including Paul Cuffee Middle School and Blessed Sacrament School.
Ownership History
Date
Name
Owned For
Owner Type
Purchase Details
Closed on
Dec 23, 2025
Sold by
Deleon Elia L
Bought by
Sky Builders Corp
Current Estimated Value
Purchase Details
Closed on
Jun 7, 2025
Sold by
Rodriguez Norman A
Bought by
Deleon Elias L
Purchase Details
Closed on
Aug 1, 2007
Sold by
1B Holdings Llc
Bought by
Reyes Edgar
Purchase Details
Closed on
Sep 1, 2006
Sold by
Melendez Wilfredo and Melendez Maricel
Bought by
1B Property Holdings L
Purchase Details
Closed on
Feb 6, 1995
Sold by
Olneyville Hsng Corp
Bought by
Melendez Wilfredo and Melendez Maricel
Create a Home Valuation Report for This Property
The Home Valuation Report is an in-depth analysis detailing your home's value as well as a comparison with similar homes in the area
Home Values in the Area
Average Home Value in this Area
Purchase History
| Date | Buyer | Sale Price | Title Company |
|---|---|---|---|
| Sky Builders Corp | $440,000 | -- | |
| Deleon Elias L | $370,000 | -- | |
| Deleon Elias L | $370,000 | -- | |
| Deleon Elias L | $370,000 | -- | |
| Deleon Elias L | $370,000 | -- | |
| Reyes Edgar | $45,000 | -- | |
| Reyes Edgar | $45,000 | -- | |
| 1B Property Holdings L | $100,000 | -- | |
| 1B Property Holdings L | $100,000 | -- | |
| Melendez Wilfredo | $55,000 | -- | |
| Melendez Wilfredo | $55,000 | -- |
Source: Public Records
Mortgage History
| Date | Status | Borrower | Loan Amount |
|---|---|---|---|
| Previous Owner | Melendez Wilfredo | $20,900 | |
| Previous Owner | Melendez Wilfredo | $123,500 |
Source: Public Records
Tax History
| Year | Tax Paid | Tax Assessment Tax Assessment Total Assessment is a certain percentage of the fair market value that is determined by local assessors to be the total taxable value of land and additions on the property. | Land | Improvement |
|---|---|---|---|---|
| 2025 | $5,528 | $378,600 | $144,900 | $233,700 |
| 2024 | $5,544 | $302,100 | $70,500 | $231,600 |
| 2023 | $5,544 | $302,100 | $70,500 | $231,600 |
| 2022 | $5,377 | $302,100 | $70,500 | $231,600 |
| 2021 | $4,168 | $169,700 | $32,800 | $136,900 |
| 2020 | $4,168 | $169,700 | $32,800 | $136,900 |
| 2019 | $4,168 | $169,700 | $32,800 | $136,900 |
| 2018 | $3,755 | $117,500 | $27,100 | $90,400 |
| 2017 | $3,755 | $117,500 | $27,100 | $90,400 |
| 2016 | $3,755 | $117,500 | $27,100 | $90,400 |
| 2015 | $3,949 | $119,300 | $32,500 | $86,800 |
| 2014 | $4,026 | $119,300 | $32,500 | $86,800 |
| 2013 | $4,026 | $119,300 | $32,500 | $86,800 |
Source: Public Records
Map
Nearby Homes
Your Personal Tour Guide
Ask me questions while you tour the home.