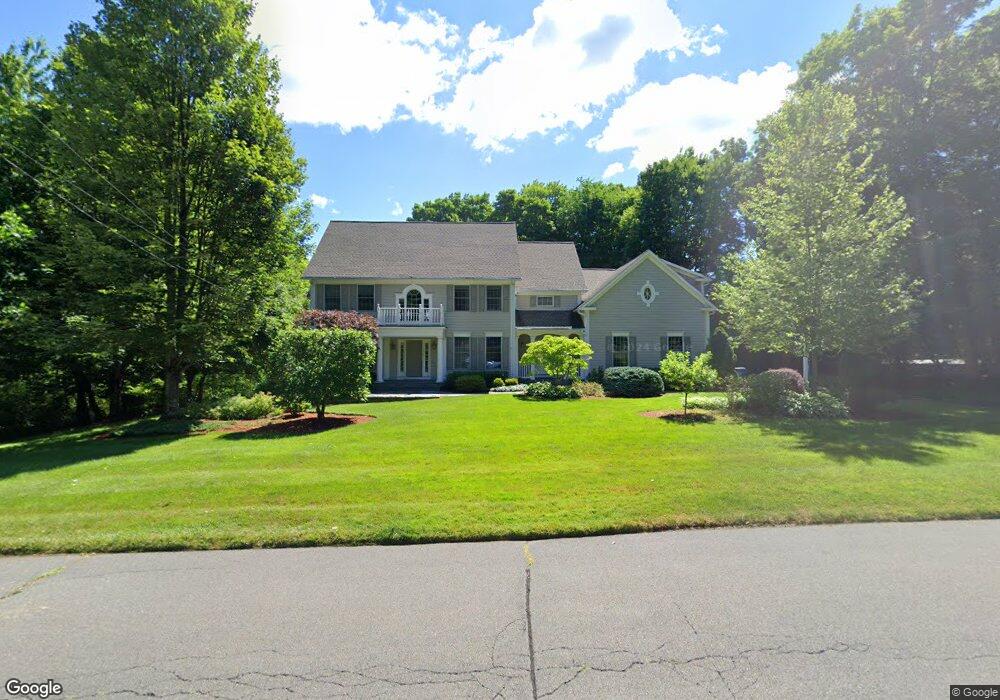
64 Arlen Way West Hartford, CT 06117
Estimated Value: $964,000 - $1,292,000
5
Beds
4
Baths
4,114
Sq Ft
$275/Sq Ft
Est. Value
About This Home
This home is located at 64 Arlen Way, West Hartford, CT 06117 and is currently estimated at $1,131,563, approximately $275 per square foot. 64 Arlen Way is a home located in Hartford County with nearby schools including Norfeldt School, King Philip Middle School, and Hall High School.
Ownership History
Date
Name
Owned For
Owner Type
Purchase Details
Closed on
Jan 10, 2013
Sold by
Piaker Steve
Bought by
Piaker Randi L
Current Estimated Value
Home Financials for this Owner
Home Financials are based on the most recent Mortgage that was taken out on this home.
Original Mortgage
$417,000
Outstanding Balance
$289,728
Interest Rate
3.43%
Estimated Equity
$841,835
Purchase Details
Closed on
Dec 24, 2012
Sold by
Piaker Randi L
Bought by
Piaker Randi L and Piaker Steve
Home Financials for this Owner
Home Financials are based on the most recent Mortgage that was taken out on this home.
Original Mortgage
$417,000
Outstanding Balance
$289,728
Interest Rate
3.43%
Estimated Equity
$841,835
Purchase Details
Closed on
Jun 13, 1997
Sold by
Rjm & Assoc Llc
Bought by
Piaker Steven F and Piaker Randi
Home Financials for this Owner
Home Financials are based on the most recent Mortgage that was taken out on this home.
Original Mortgage
$300,000
Interest Rate
6.88%
Mortgage Type
Unknown
Create a Home Valuation Report for This Property
The Home Valuation Report is an in-depth analysis detailing your home's value as well as a comparison with similar homes in the area
Home Values in the Area
Average Home Value in this Area
Purchase History
| Date | Buyer | Sale Price | Title Company |
|---|---|---|---|
| Piaker Randi L | -- | -- | |
| Piaker Randi L | -- | -- | |
| Piaker Steven F | $449,000 | -- |
Source: Public Records
Mortgage History
| Date | Status | Borrower | Loan Amount |
|---|---|---|---|
| Open | Piaker Randi L | $263,000 | |
| Open | Piaker Randi L | $417,000 | |
| Previous Owner | Piaker Steven F | $417,000 | |
| Previous Owner | Piaker Steven F | $300,000 | |
| Previous Owner | Piaker Steven F | $291,500 | |
| Previous Owner | Piaker Steven F | $300,000 |
Source: Public Records
Tax History Compared to Growth
Tax History
| Year | Tax Paid | Tax Assessment Tax Assessment Total Assessment is a certain percentage of the fair market value that is determined by local assessors to be the total taxable value of land and additions on the property. | Land | Improvement |
|---|---|---|---|---|
| 2025 | $21,789 | $486,570 | $89,110 | $397,460 |
| 2024 | $20,606 | $486,570 | $89,110 | $397,460 |
| 2023 | $19,910 | $486,570 | $89,110 | $397,460 |
| 2022 | $19,794 | $486,570 | $89,110 | $397,460 |
| 2021 | $18,354 | $432,670 | $89,110 | $343,560 |
| 2020 | $18,925 | $452,760 | $83,300 | $369,460 |
| 2019 | $18,925 | $452,760 | $83,300 | $369,460 |
| 2018 | $18,563 | $452,760 | $83,300 | $369,460 |
| 2017 | $18,581 | $452,760 | $83,300 | $369,460 |
| 2016 | $15,109 | $382,410 | $89,180 | $293,230 |
| 2015 | $14,650 | $382,410 | $89,180 | $293,230 |
| 2014 | $14,291 | $382,410 | $89,180 | $293,230 |
Source: Public Records
Map
Nearby Homes
- 75 Arlen Way
- 40 Ferncliff Dr
- 10 Ironwood Ln
- 21 Barksdale Rd
- 25 Lakeview Dr
- 17 Cranbrook
- 592 Mountain Rd Unit A
- 1 Cedar Close
- 11 Rye Ridge Pkwy
- 34 Cary Ln Unit 34
- 50 Magnolia Hill
- 124 High Ridge Rd
- 30 Biltmore Park Unit 30
- 2581 Albany Ave
- 16 Morningcrest Dr
- 365 Simsbury Rd
- 47 Flagg Rd
- 21 Rushleigh Rd
- 15 Rushleigh Rd
- 62 Blue Ridge Ln