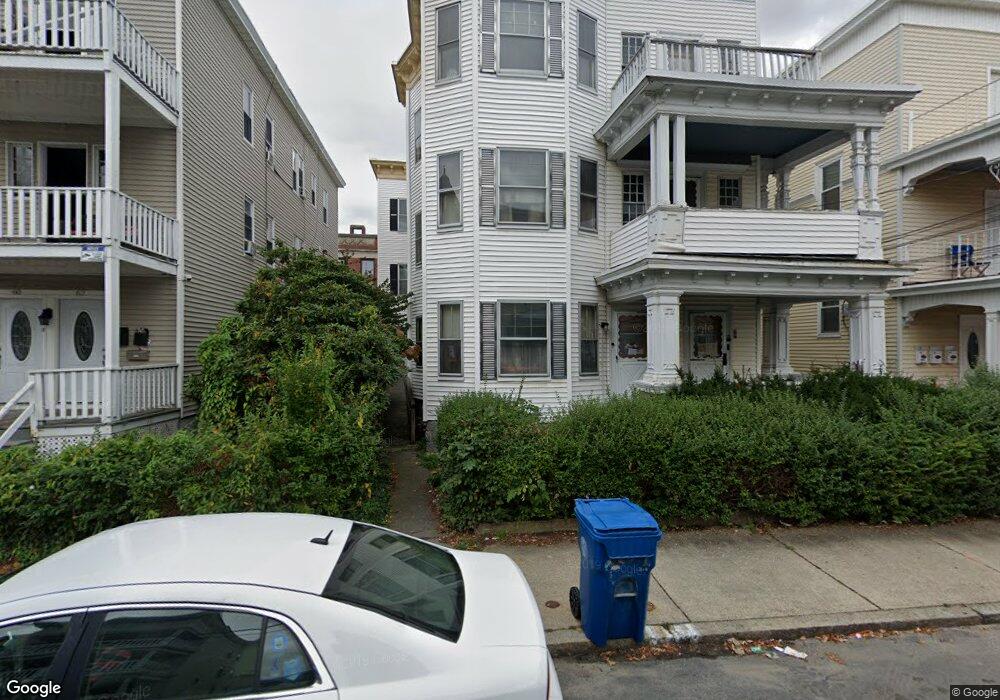
64 Avon St Unit 66 Lawrence, MA 01841
Arlington NeighborhoodEstimated Value: $782,000 - $897,000
9
Beds
3
Baths
4,791
Sq Ft
$179/Sq Ft
Est. Value
About This Home
This home is located at 64 Avon St Unit 66, Lawrence, MA 01841 and is currently estimated at $856,667, approximately $178 per square foot. 64 Avon St Unit 66 is a home located in Essex County with nearby schools including Olive Branch Elementary School, Hawkins Elementary SMART School, and School For Exceptional Studies.
Ownership History
Date
Name
Owned For
Owner Type
Purchase Details
Closed on
Aug 26, 2024
Sold by
Stundza William A Est and Stundzia
Bought by
Herasme Orlando and Herasme Nilka T
Current Estimated Value
Home Financials for this Owner
Home Financials are based on the most recent Mortgage that was taken out on this home.
Original Mortgage
$376,000
Outstanding Balance
$371,422
Interest Rate
6.89%
Mortgage Type
Purchase Money Mortgage
Estimated Equity
$485,245
Purchase Details
Closed on
Jul 13, 2020
Sold by
Restatement Of Stundza T and Stundza
Bought by
Stundza William A
Purchase Details
Closed on
Mar 2, 2012
Sold by
Stundza T and Stundza Matilda J
Bought by
Stundza T and Stundza Matilda J
Purchase Details
Closed on
Feb 17, 2005
Sold by
Stundza Matilda J
Bought by
Stundza T T and Stundza S
Create a Home Valuation Report for This Property
The Home Valuation Report is an in-depth analysis detailing your home's value as well as a comparison with similar homes in the area
Home Values in the Area
Average Home Value in this Area
Purchase History
| Date | Buyer | Sale Price | Title Company |
|---|---|---|---|
| Herasme Orlando | $470,000 | None Available | |
| Herasme Orlando | $470,000 | None Available | |
| Stundza William A | -- | None Available | |
| Stundza William A | -- | None Available | |
| Stundza T | -- | -- | |
| Stundza T T | -- | -- | |
| Stundza T T | -- | -- | |
| Stundza T T | -- | -- |
Source: Public Records
Mortgage History
| Date | Status | Borrower | Loan Amount |
|---|---|---|---|
| Open | Herasme Orlando | $376,000 | |
| Closed | Herasme Orlando | $376,000 |
Source: Public Records
Tax History Compared to Growth
Tax History
| Year | Tax Paid | Tax Assessment Tax Assessment Total Assessment is a certain percentage of the fair market value that is determined by local assessors to be the total taxable value of land and additions on the property. | Land | Improvement |
|---|---|---|---|---|
| 2025 | $6,561 | $745,600 | $107,100 | $638,500 |
| 2024 | $6,563 | $709,500 | $112,600 | $596,900 |
| 2023 | $6,550 | $644,700 | $108,700 | $536,000 |
| 2022 | $6,612 | $578,000 | $102,400 | $475,600 |
| 2021 | $6,253 | $509,600 | $102,400 | $407,200 |
| 2020 | $5,244 | $421,900 | $85,400 | $336,500 |
| 2019 | $5,078 | $371,200 | $63,400 | $307,800 |
| 2018 | $5,185 | $362,100 | $57,500 | $304,600 |
| 2017 | $4,633 | $302,000 | $54,500 | $247,500 |
| 2016 | $4,194 | $270,400 | $42,500 | $227,900 |
| 2015 | $4,022 | $266,000 | $42,500 | $223,500 |
Source: Public Records
Map
Nearby Homes
- 131A Lawrence St Unit 40
- 24 Bennington St
- 129-131 Lexington St
- 32 Alma St Unit 32
- 192 Union St
- 100-102 E Haverhill St
- 65 Brook St
- 89 Newbury St Unit 89B
- 6 Brook St
- 11 Lawrence St Unit 606
- 27 Exchange St
- 434-438 Hampshire St
- 20 Knox St Unit 43
- 20 Knox St Unit 23
- 29 Willow St Unit B
- 32 Orchard St
- 46 Amesbury St Unit 2B
- 46 Amesbury St Unit 4D
- 169 Berkeley St
- 42 Union St
- 60 Avon St Unit 62
- 60-62 Avon St
- 68 Avon St Unit 70
- 68 Avon St
- 56 Avon St Unit 58
- 63 Avon St Unit 65
- 59 Avon St Unit 61
- 24 Trinity St
- 52 Avon St
- 72 Avon St Unit 74
- 67 Avon St Unit 69
- 27-29 Bruce St
- 76 Avon St Unit 78
- 31-35 Bruce St
- 31 Bruce St Unit 35
- 71 Avon St
- 21 Bruce St Unit 23
- 23 Bruce St
- 21 Bruce St Unit 1
- 27 Bruce St Unit 29