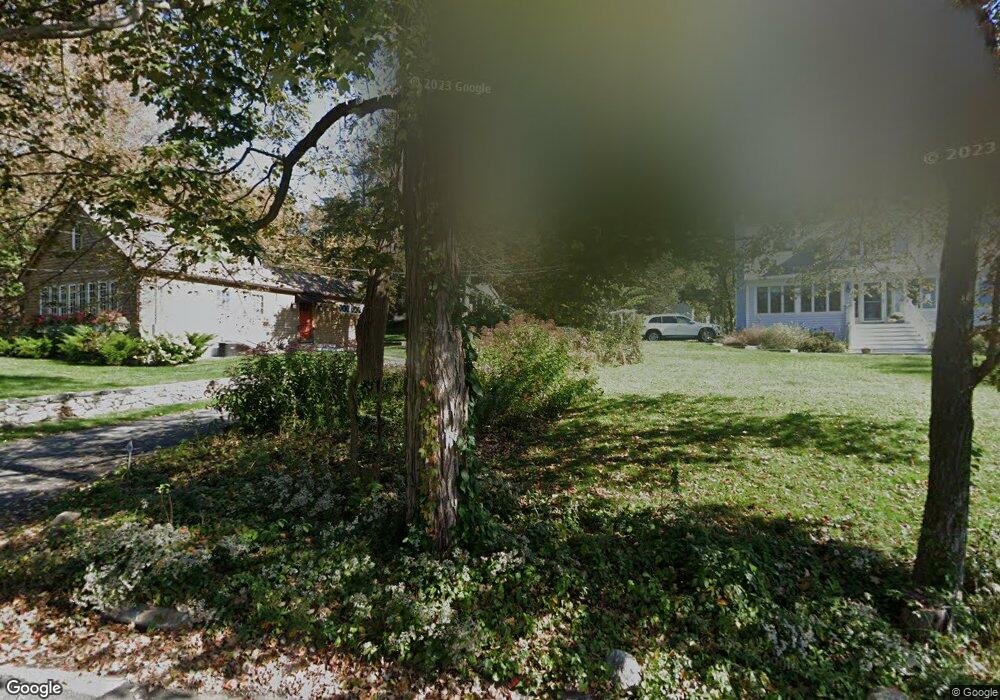
64 Ball Pond Rd E New Fairfield, CT 06812
Estimated Value: $508,564 - $600,000
2
Beds
4
Baths
1,949
Sq Ft
$274/Sq Ft
Est. Value
About This Home
This home is located at 64 Ball Pond Rd E, New Fairfield, CT 06812 and is currently estimated at $534,891, approximately $274 per square foot. 64 Ball Pond Rd E is a home located in Fairfield County with nearby schools including Meeting House Hill School, New Fairfield Middle School, and New Fairfield High School.
Ownership History
Date
Name
Owned For
Owner Type
Purchase Details
Closed on
May 9, 2024
Sold by
Nunes Anthony M and Nunes Heather
Bought by
Nunes Heather
Current Estimated Value
Home Financials for this Owner
Home Financials are based on the most recent Mortgage that was taken out on this home.
Original Mortgage
$333,750
Outstanding Balance
$328,607
Interest Rate
6.38%
Mortgage Type
Adjustable Rate Mortgage/ARM
Estimated Equity
$206,284
Purchase Details
Closed on
Oct 23, 2007
Sold by
Mitchell Doreen
Bought by
Nunes Anthony M and Nunes Heather
Home Financials for this Owner
Home Financials are based on the most recent Mortgage that was taken out on this home.
Original Mortgage
$281,200
Interest Rate
6.51%
Purchase Details
Closed on
Jul 23, 1994
Sold by
Fulton Lester Est
Bought by
Mitchell Doreen
Create a Home Valuation Report for This Property
The Home Valuation Report is an in-depth analysis detailing your home's value as well as a comparison with similar homes in the area
Home Values in the Area
Average Home Value in this Area
Purchase History
| Date | Buyer | Sale Price | Title Company |
|---|---|---|---|
| Nunes Heather | -- | None Available | |
| Nunes Heather | -- | None Available | |
| Nunes Anthony M | $312,500 | -- | |
| Mitchell Doreen | $120,000 | -- | |
| Nunes Anthony M | $312,500 | -- | |
| Mitchell Doreen | $120,000 | -- |
Source: Public Records
Mortgage History
| Date | Status | Borrower | Loan Amount |
|---|---|---|---|
| Open | Nunes Heather | $333,750 | |
| Closed | Nunes Heather | $333,750 | |
| Previous Owner | Mitchell Doreen | $281,200 | |
| Previous Owner | Mitchell Doreen | $100,722 |
Source: Public Records
Tax History
| Year | Tax Paid | Tax Assessment Tax Assessment Total Assessment is a certain percentage of the fair market value that is determined by local assessors to be the total taxable value of land and additions on the property. | Land | Improvement |
|---|---|---|---|---|
| 2025 | $7,846 | $298,000 | $82,000 | $216,000 |
| 2024 | $6,599 | $180,700 | $74,100 | $106,600 |
| 2023 | $6,306 | $180,700 | $74,100 | $106,600 |
| 2022 | $5,867 | $180,700 | $74,100 | $106,600 |
| 2021 | $5,690 | $180,700 | $74,100 | $106,600 |
| 2020 | $5,526 | $180,700 | $74,100 | $106,600 |
| 2019 | $5,553 | $179,700 | $74,100 | $105,600 |
| 2018 | $5,495 | $179,700 | $74,100 | $105,600 |
| 2017 | $5,359 | $179,700 | $74,100 | $105,600 |
| 2016 | $5,154 | $179,700 | $74,100 | $105,600 |
| 2015 | $5,154 | $179,700 | $74,100 | $105,600 |
| 2014 | $4,705 | $180,400 | $78,000 | $102,400 |
Source: Public Records
Map
Nearby Homes
- 66 Ball Pond Rd E
- 68 Ball Pond Rd E
- 62 Ball Pond Rd E
- 58 Ball Pond Rd E
- 60 Ball Pond Rd E
- 63 Ball Pond Rd E
- 65 Ball Pond Rd E
- 61 Ball Pond Rd E
- 54 Ball Pond Rd E
- 59 Ball Pond Rd E
- 67 Ball Pond Rd E
- 224 Ball Pond Rd
- 226 Ball Pond Rd
- 52 Ball Pond Rd E
- 147 Ball Pond Rd
- 57 Ball Pond Rd E
- 145 Ct-39
- 145 Ball Pond Rd
- 1 Waterview Dr
- 53 Ball Pond Rd E
Your Personal Tour Guide
Ask me questions while you tour the home.