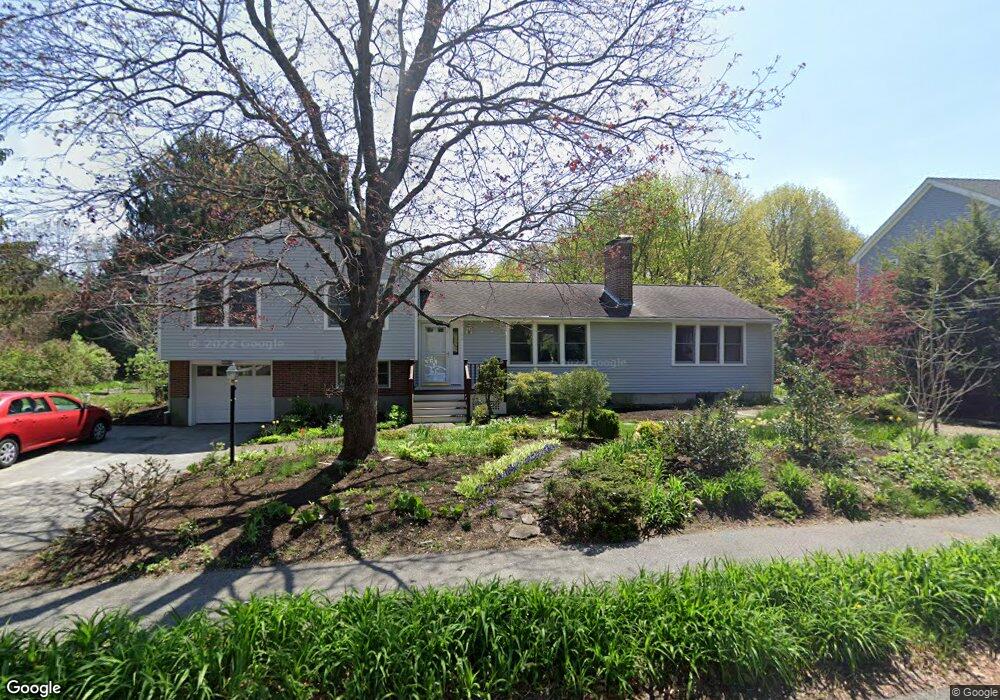
64 Bayberry Rd Concord, MA 01742
Estimated Value: $955,000 - $1,134,000
3
Beds
3
Baths
1,658
Sq Ft
$636/Sq Ft
Est. Value
About This Home
This home is located at 64 Bayberry Rd, Concord, MA 01742 and is currently estimated at $1,054,050, approximately $635 per square foot. 64 Bayberry Rd is a home located in Middlesex County with nearby schools including Thoreau Elementary School, Concord Middle School, and Concord Carlisle High School.
Ownership History
Date
Name
Owned For
Owner Type
Purchase Details
Closed on
Feb 27, 2014
Sold by
Knight 2012 Sullender and Sullender Dean G
Bought by
Sullender Dean G and Knight Suzanne M
Current Estimated Value
Home Financials for this Owner
Home Financials are based on the most recent Mortgage that was taken out on this home.
Original Mortgage
$272,550
Outstanding Balance
$194,266
Interest Rate
3%
Mortgage Type
Adjustable Rate Mortgage/ARM
Estimated Equity
$859,784
Purchase Details
Closed on
Apr 17, 2013
Sold by
Sullender Dean G and Knight Suzanne M
Bought by
Sullender Knight Ft and Sullender Dean G
Purchase Details
Closed on
Feb 22, 2001
Sold by
Mcfee Gregory H and Mcfee Penny C
Bought by
Sullender Dean G and Knight Suzanne M
Home Financials for this Owner
Home Financials are based on the most recent Mortgage that was taken out on this home.
Original Mortgage
$236,000
Interest Rate
6.89%
Mortgage Type
Purchase Money Mortgage
Purchase Details
Closed on
Aug 11, 1995
Sold by
Gelo Mark A and Gelo Norma J
Bought by
Mcfee Gregory H and Mcfee Penny C
Create a Home Valuation Report for This Property
The Home Valuation Report is an in-depth analysis detailing your home's value as well as a comparison with similar homes in the area
Home Values in the Area
Average Home Value in this Area
Purchase History
| Date | Buyer | Sale Price | Title Company |
|---|---|---|---|
| Sullender Dean G | -- | -- | |
| Sullender Knight Ft | -- | -- | |
| Sullender Dean G | $417,500 | -- | |
| Mcfee Gregory H | $269,000 | -- |
Source: Public Records
Mortgage History
| Date | Status | Borrower | Loan Amount |
|---|---|---|---|
| Open | Sullender Dean G | $272,550 | |
| Previous Owner | Mcfee Gregory H | $300,500 | |
| Previous Owner | Mcfee Gregory H | $236,000 |
Source: Public Records
Tax History
| Year | Tax Paid | Tax Assessment Tax Assessment Total Assessment is a certain percentage of the fair market value that is determined by local assessors to be the total taxable value of land and additions on the property. | Land | Improvement |
|---|---|---|---|---|
| 2025 | $129 | $971,500 | $513,500 | $458,000 |
| 2024 | $12,263 | $934,000 | $513,500 | $420,500 |
| 2023 | $11,499 | $887,300 | $466,800 | $420,500 |
| 2022 | $10,609 | $718,800 | $373,400 | $345,400 |
| 2021 | $10,457 | $710,400 | $373,400 | $337,000 |
| 2020 | $9,844 | $691,800 | $373,400 | $318,400 |
| 2019 | $9,991 | $704,100 | $385,700 | $318,400 |
| 2018 | $9,554 | $668,600 | $354,000 | $314,600 |
| 2017 | $8,898 | $632,400 | $328,700 | $303,700 |
| 2016 | $8,946 | $642,700 | $328,700 | $314,000 |
| 2015 | $8,377 | $586,200 | $304,400 | $281,800 |
Source: Public Records
Map
Nearby Homes
- 65 Summit St
- 245 Oak Hill Cir
- 59 Lexington Dr
- 303 School St
- 66 Old Stow Rd
- 42 Sunnyside Ln
- 37 Water St
- 27 Water St
- 116 Conant St
- 20 Westvale Meadows Unit C
- 95 Conant St Unit 320
- 67 Conant St
- 22 Center Village Dr
- 1844 Main St Unit 1844
- 54 Maple St
- 102 Highland St
- 70 McCallar Ln
- 32 Highland St
- 53 Prairie St
- 111 Central St
Your Personal Tour Guide
Ask me questions while you tour the home.